AUS200 trade ideas


nice PCP TO SELLPRICE SHOWS BEARISH PRICE ACTION.IT BROKE A DAILY DEMAND LEVEL.
ONCE TP IS HIT THE ORDER MUST BE REMOVED

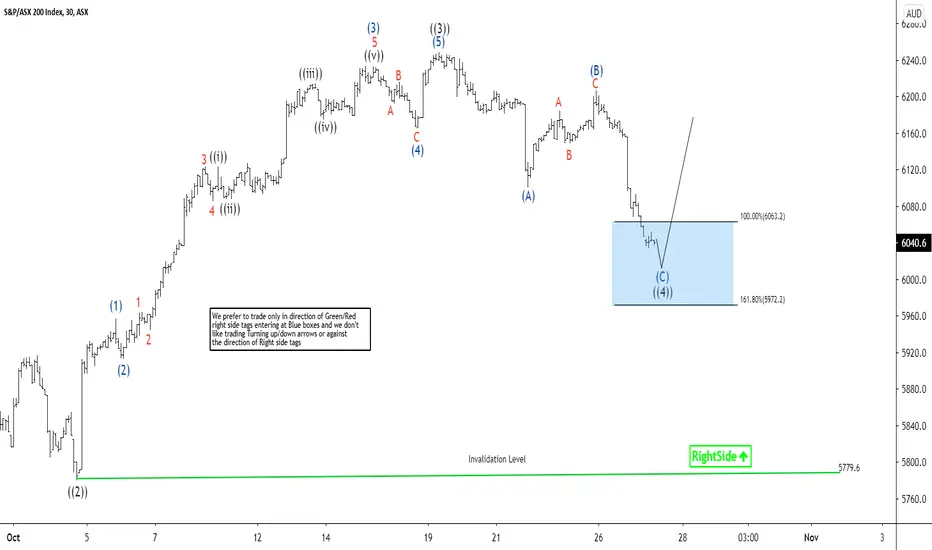
Elliott Wave View: ASX 200 Looking for SupportShort term Elliott Wave View in ASX 200 (XJO) suggests that cycle from September 22, 2020 low is in progress as a 5 waves impulse structure. In the 30 minutes chart below, Index ended wave ((2)) of this impulsive move from September 22 at 5779.6. Wave ((3)) higher ended at 6248.3 with internal subdivision as another impulse of lesser degree. Up from wave ((2)) low at 5779.6, wave (1) ended at 5957.1 and wave (2) pullback ended at 5912.7. Index then resumed higher in wave (3) towards 6232.8 and wave (4) dips ended at 6165. Final leg higher wave (5) ended at 6248.3. This completed wave ((3)) in the higher degree.
Wave ((4)) pullback is currently in progress to correct cycle from October 2 low as a zigzag. Down from wave ((3)) at 6248.3, wave (A) ended at 6100.6 and wave B bounce ended at 6206.5. Index then turned lower in wave (C) and it has reached the 100% extension area at 5969 – 6060. Buyers may appear from this area for more upside or a 3 waves bounce at least. As far as wave ((2)) pivot at 5779.6 low stays intact, expect the Index to turn higher from the blue box in 3 waves at least.


AU200AUD SHORT TRADE SETUP USING MULTITIMEFRAME ANALYSISDon't forget to give this a like. Feel free to ask any question or comment.
Thank you

Australian Index is Over ExtendedAs what i see, this index is too ever extended and should be drop soon
I know it is a bullish market but it cant just go straight to north, there must be a healthy correction first at broken daily Inverted HNS neckline


AUS200 just broke the daily resistance ***************************************************************************************************************************************************************************************************
DO YOUR RISK MANAGEMENT AND MAKE SURE TO FOLLOW YOUR STRATEGY LIKE IF THIS WAS HELPFUL TELL US WHAT YOU THINK IN THE COMMENTS THANKS YOU
***************************************************************************************************************************************************************************************************


AU200 SHORT (SELL)AU200 SHORT (SELL) once markets open on Monday. Chart explains itself. SL and TP's correctly calculated. Good Luck

AU200 NEUTRAL - NO TRADEThe AU200 has reached a resistance area on the D1 and we could be expected a reversal soon (correction) Once the major bullish trend-line (resistance area) has been reached I will be looking at a possible BUY.

Another Country Breaking Out - Australia!When we look around the world, it often feels like the sky is falling if you tune into financial media. Well here, we look at the charts and see if we can find trends. We have a new breakout in an important commodity economy. Australia! Let’s have a look at the chart.
So here we have Australia going nowhere since June. Tons of failed breakouts with the wicks not being able to stay above 6130. We finally get the breakout with follow through as well. Not only do we have the breakout in price, we also have a breakout in RSI terms. This is bullish. Right now we are looking for stuff to buy. We have made that clear. Now we can add Australia to the list of markets that are breaking out.
Happy Trading!


XJO breakout imminentS&P 200 (XJO) is currently pulling back at resistance, but has formed a great looking Darvas box. If it can break above 6200 and hold support, we are going to around 6650.
A fib extension still puts the next move to 6300. I expect a pull back to test 6200 support, then resumption upward. After that the next extension is just above the ATH.
This is also forming the start of an Elliot wave after the counter trend move (consolidation).

AUS200 LevelImportant level on AUS200.
Wait for the breakout to the upside to consider longs or to a bearish flag to consider shorts.

Where does all this money go?You can keep hitting and kicking peeps down with unlimited dollars
but you'll only be rewarded with higher everything.

Australia 200 - just an ideaAustralian index seems to be in a very stable trading channel (since May) - but it looks like it might break out. It has a lot of upside potential - with the top of the 12 years trend channel quite high above and also the long term resistance (double ATH) being around 6950.
Plus Australia has dealt with the covid-19 pretty decently and has no spikes in cases and lockdowns on the way. (unlike Europe). I think this fact also plays its role in the recent uptrend.
So if it breaks above I consider this a feasible long term investment.

Small Rejection of Major LevelWe discussed this market yesterday and the major resistance level price had moved higher into.
The rejection of the level we were expecting has now come and price formed a solid bearish rejection candlestick.
It is rare that price will move directly into a major support or resistance level and break straight through it without some sort of rejection first.
Now we have seen that rejection we can look to see if this level will break.
If we can get a break higher we can begin hunting long breakout trades that would offer potentially higher reward trades.

XJO finally bullish or dead cat 🐈 bounce?🚨🚨For the first time in 6month, XJO aka ASX200 has spent 3 days above 200MA. Bulls should be dancing as this unprecedented at least for the last 6 months.
I will try to be brief with today’s TA. Lets analyse bull cases:
- PSAR daily and weekly pointing to the bulls court
- price above 50 and 200MA
- LSMA and QLSMA both pointing up and price above their lines
- price above historic resistance 5960
I think this is bullish at least for now.
Bears case:
- price still not able to break the 6200 resistance
I think, the market is quite interesting atm and with US elections coming soon, we need to be careful with every position we take and keep out SL tight.
I will keep you posted as this market may give juicy profit when your enter at the right time.
Stay safe and dont forget to smash the likes.
XTF

Major Resistance Now in PlayWe discussed this market yesterday and how price was looking to move into the major daily chart resistance.
Price has now made this move and is looking to attempt a breakout.
This is a major level for this market and it could present multiple trading opportunities. We could expect at least some resistance here, however a breakout higher would offer higher probability trades.
A breakout higher would expose more free space for price action to move into and a potentially more explosive move.

AUS200 retest 6200 and go back 6000 it may go up 6400 or it may go down back to the support zone 6000, the sell order has more profit and safer than the buy order in this case,
