Strong Bullish Outlook Amid Potential 1W Support RetestHello Everyone,
We’ve reached our previous target of 8123 for AUS200, and the price is once again testing the lows, preparing for another upward push. However, there’s currently a strong likelihood that the price may retest the 1-week support structure. Despite this, our long-term outlook remains strongly bullish!
TradeWithTheTrend3344
AUS200 trade ideas

Domino Effect -Australia's Exposure to a Sino-Taiwanese ConflictA potential armed conflict in the Taiwan Strait poses significant geopolitical risks with profound economic implications for Australia. As a key member of the Five Eyes intelligence alliance, Australia’s strategic interests are deeply intertwined with regional stability. The potential impact of such a conflict on the Australian economy.
Economic Impact Assessment
A Sino-Taiwanese conflict would likely trigger severe economic disruptions for Australia. The nation's reliance on China as a primary trading partner, particularly in the mining and agricultural sectors, would exacerbate the negative impacts. Key sectors and their potential implications are outlined below:
Mining: As a dominant contributor to Australia's GDP and a significant component of the S&P/ASX 200, the mining sector would face substantial challenges. Disruptions to iron ore and coal exports to China would negatively impact major mining companies such as BHP Group and Rio Tinto, collectively representing approximately 5% of the index.
Agriculture: Given China's status as a key market for Australian agricultural products, the sector would experience significant revenue losses. This would affect companies involved in grain, meat, and dairy production, although their overall weight in the S&P/ASX 200 is relatively smaller.
Tourism: The tourism industry, still recovering from the COVID-19 pandemic, would face renewed challenges due to decreased international travel. Qantas Airways, a prominent component of the S&P/ASX 200, would be directly affected by declining passenger numbers.
Financial Services: The broader financial system would likely experience increased volatility, credit rating downgrades, and elevated insurance claims. Australia's major banks, including Commonwealth Bank, Westpac, and ANZ, which collectively hold substantial weight in the S&P/ASX 200, would be exposed to these risks.
Implications for the S&P/ASX 200
The S&P/ASX 200, as a market-capitalization-weighted index, would undoubtedly reflect the economic challenges posed by a Sino-Taiwanese conflict. Given the significant weightings of mining and financial services in the index, a sharp decline is highly probable. The severity and duration of the market downturn would depend on the scale and duration of the conflict.
Historical Precedent
While direct comparisons are limited due to evolving economic structures and geopolitical contexts, historical data from World War II and the Korean War provide valuable insights. Both periods were characterized by significant market volatility, with sharp declines followed by varying recovery periods.
Conclusion
A Sino-Taiwanese conflict presents substantial economic risks for Australia, with the S&P/ASX 200 serving as a barometer of these challenges. The potential impact on the Australian economy and financial markets underscores the importance of robust risk management strategies and contingency planning.

AUS200 in Bullish TrendI have been monitoring this index for quite a while. It made a bearish flag on an hourly chart. There was a bullish divergence which propelled the chart to get bullish which resulted in the formation of a bearish flag. I was waiting for a breakout of a bearish flag to put a short trade for the index but the breakout turned out to be a false one. The trend is bullish now and I have marked a key support level. I have now placed a pending order of Buy Limit by using FIB. No divergence is noted on the current trend.
The Signal is:
EP: 7828.22
SL: 7765.61
TP: 7890.83
RR: 0.5%

AUS200 ANALYSIS AUS200 has formed a sweep of the previous high and then change of Character waiting for the retest of the the failed order block which will be my entry.

AUS----200-------Bearish there are series of lower low and low high and before there is bearish divergence and trend is retest the support becomes resistance


Cypher to Break Aussie FlagASX200 is in a Bullish Flag configuration, as this equity index (as with many others) is in
a corrective mode.
Within this pattern, a Harmonic may also be in the making. Specifically, a Cypher Pattern with
a 1.41 extension.
Keeping a watch on this index for a move towards 7825-7850.
In a larger scheme, this move is simply a retest of a HTF breakout.
If price holds above 8000 , it would be a bullish sign.
Below 7800, and its back into the Rectangular consolidation.

AUS2001) Range breakout
2) Aus200 Printing HH and HL
Move your Stop Loss to the Entry Point when TP 1 get hit.

Is it over for AUS200 bulls? The Australian Stock Market Index ended last week with a powerful breakout from a 107-day-old triangle pattern. Despite corrections this pattern remains valid as long as the index stays above the breakout candle low of 7795. Between 7902 and 7795, traders are likely to seek buying opportunities on dips, aiming for the pattern target of 8197.
This content is not directed to residents of the EU or UK.
Any opinions, news, research, analyses, prices or other information contained on this website is provided as general market commentary and does not constitute investment advice. ThinkMarkets will not accept liability for any loss or damage including, without limitation, to any loss of profit which may arise directly or indirectly from use of or reliance on such information.

XJO (ASX200): 19 JUL, 2024© Master of Elliott Wave Analysis: Hua (Shane) Cuong, CEWA-M (Master's Designation).
Forecast: Bullish
Position: Fourth Wave
Wave (iii)-orange is opening up to push higher, it is subdividing into wave iv-gray. The fourth wave will push down a bit and soon expire, then the gray v-wave will return to continue pushing higher.
Invalidation point: 7,819.0

Aussie Flag BreakoutThe ASX 200 on the intraday chart has formed a Pole and Flag Pattern. It appears there maybe a breakout to the upside.
The long trade is on chart
1. Enter - at breakout of 8050
2. Stop - if this is a valid breakout, then 1/3 the flag consolidation should be sufficient.
3. Target - Either a measured move or the D point
RR = 3+

AUS---200-----Bullishthere is no divergence in H4 when see round shape make a entry and there is break of resistance

AUS200-----Bearishthere is price rejection at resistance with divergence also there is cross of 20ema with 50 ema

ASX rally to stall at market price?ASX200 - 24h expiry
Indecisive price action has resulted in sideways congestion on the daily chart.
RSI (relative strength indicator) is flat and reading close to 50 (mid-point) highlighting the fact that we are non- trending.
We expect a reversal in this move.
Risk/Reward would be poor to call a sell from current levels.
A move through 7770 will confirm the bearish momentum.
The measured move target is 7725.
We look to Sell at 7800 (stop at 7832)
Our profit targets will be 7720 and 7700
Resistance: 7775 / 7800 / 7825
Support: 7750 / 7735 / 7725
Risk Disclaimer
The trade ideas beyond this page are for informational purposes only and do not constitute investment advice or a solicitation to trade. This information is provided by Signal Centre, a third-party unaffiliated with OANDA, and is intended for general circulation only. OANDA does not guarantee the accuracy of this information and assumes no responsibilities for the information provided by the third party. The information does not take into account the specific investment objectives, financial situation, or particular needs of any particular person. You should take into account your specific investment objectives, financial situation, and particular needs before making a commitment to trade, including seeking advice from an independent financial adviser regarding the suitability of the investment, under a separate engagement, as you deem fit.
You accept that you assume all risks in independently viewing the contents and selecting a chosen strategy.
Where the research is distributed in Singapore to a person who is not an Accredited Investor, Expert Investor or an Institutional Investor, Oanda Asia Pacific Pte Ltd (“OAP“) accepts legal responsibility for the contents of the report to such persons only to the extent required by law. Singapore customers should contact OAP at 6579 8289 for matters arising from, or in connection with, the information/research distributed.

ASX AUD- Long Set UpLooks like reversal on 1H TF. Have my buy stop / entry at 7762.
Entry - 7762
Stoploss - 7672.5
TP-1 - 7852.2
TP-2 - 7942.8
#Trading #Technical #Crypto #Stocks #commodities

AU200AUD to continue in the upward move?ASX200 - 24h expiry
There is no clear indication that the upward move is coming to an end.
Although we remain bullish overall, a correction is possible with plenty of room to move lower without impacting the trend higher.
Risk/Reward would be poor to call a buy from current levels.
A move through 7800 will confirm the bullish momentum.
The measured move target is 7850.
We look to Buy at 7750 (stop at 7710)
Our profit targets will be 7825 and 7850
Resistance: 7800 / 7825 / 7850
Support: 7750 / 7725 / 7700
Risk Disclaimer
The trade ideas beyond this page are for informational purposes only and do not constitute investment advice or a solicitation to trade. This information is provided by Signal Centre, a third-party unaffiliated with OANDA, and is intended for general circulation only. OANDA does not guarantee the accuracy of this information and assumes no responsibilities for the information provided by the third party. The information does not take into account the specific investment objectives, financial situation, or particular needs of any particular person. You should take into account your specific investment objectives, financial situation, and particular needs before making a commitment to trade, including seeking advice from an independent financial adviser regarding the suitability of the investment, under a separate engagement, as you deem fit.
You accept that you assume all risks in independently viewing the contents and selecting a chosen strategy.
Where the research is distributed in Singapore to a person who is not an Accredited Investor, Expert Investor or an Institutional Investor, Oanda Asia Pacific Pte Ltd (“OAP“) accepts legal responsibility for the contents of the report to such persons only to the extent required by law. Singapore customers should contact OAP at 6579 8289 for matters arising from, or in connection with, the information/research distributed.

AUS200 RISING IN THE SHORT-TERMIn the short term as we can see my prediction, the price is rising up on the australian index, the possible rise is 7,894 with confluence on second impulse and 161% fibonacci level

AU Weekly Idea 5.28.24My Usual Setup that I didn't publish... still has some interesting levels to play out.

AU200AUD short term RSI has turned positive.ASX200 - 24h expiry
The correction lower is assessed as being complete.
Short term RSI has turned positive.
Further upside is expected.
Risk/Reward would be poor to call a buy from current levels.
A move through 7825 will confirm the bullish momentum.
We look to Buy at 7775 (stop at 7735)
Our profit targets will be 7875 and 7895
Resistance: 7825 / 7850 / 7875
Support: 7800 / 7775 / 7750
Risk Disclaimer
The trade ideas beyond this page are for informational purposes only and do not constitute investment advice or a solicitation to trade. This information is provided by Signal Centre, a third-party unaffiliated with OANDA, and is intended for general circulation only. OANDA does not guarantee the accuracy of this information and assumes no responsibilities for the information provided by the third party. The information does not take into account the specific investment objectives, financial situation, or particular needs of any particular person. You should take into account your specific investment objectives, financial situation, and particular needs before making a commitment to trade, including seeking advice from an independent financial adviser regarding the suitability of the investment, under a separate engagement, as you deem fit.
You accept that you assume all risks in independently viewing the contents and selecting a chosen strategy.
Where the research is distributed in Singapore to a person who is not an Accredited Investor, Expert Investor or an Institutional Investor, Oanda Asia Pacific Pte Ltd (“OAP“) accepts legal responsibility for the contents of the report to such persons only to the extent required by law. Singapore customers should contact OAP at 6579 8289 for matters arising from, or in connection with, the information/research distributed.

aus200buyers took control of the market the previous lower lows supply held it's too strong.switch to 30minute tf and execute your long

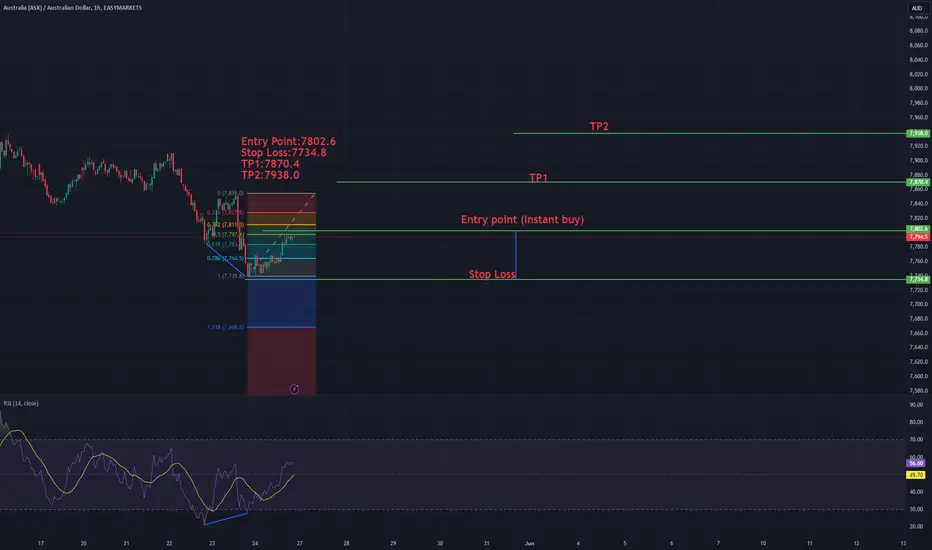
ASXAUD Forrex This Chart was printing a Bearish trend line but there is a Divergence so it will Print a Bullish trend with Ascending Continuous Pattern
The Entry Point will be instant Buy Stop .
Will Australia overcome the triple top?The Australian session has started on a positive note with both annual and quarterly retail sales in positive territory on an annual basis (previous 4.1% vs. 1.5% today) and showing a correction although still in negative territory on a quarterly basis (previous -1.9% vs. -0.3% today). Australian PMI data showed a slight decline. The Australian Federal Reserve's (RBA) consumer inflation expectations are for a slight correction from the previous 4.6% vs the current 4.5%. Tonight's session may confirm slightly downward consumer confidence, if the consensus exports, trade balance and imports are as positive as presented and show an acceleration of the Australian economy. The RBA currently has estimated consumer price inflation at around 3.6%, the previous indicator being 3.5% and the cash lending rate target is at 4.35% based on May 8 data. The truth is that we have a scalextric of emotions with interest rate expectations over Australia, and the truth is that the Australian Federal Reserve is keeping the door open to rate hikes of 0.25% in its next meetings, looking for 2024-25 to target 2.75% and not 3.5%, and looking to reach 2.5% by 2026 onwards.
The S&P/ASX 200 has shown to remain strong in the highs zone and it is also partly a result of the fact that some of its companies have a very strong correlation with the gold market which is currently in the highs zone as well as silver, which has doubled its value during this 2024 (45.41%), as well as gold has risen by 24.39%. The metals and Gas markets are very important for Australia as an exporter of technologies for these markets and one of the main suppliers of LNG to Asia.
Looking at the chart, it is currently at 7,831.16 points, with a high of 7,927.42 points and a low of 6,734.52 points. The development of the index has been slightly upward limping.
If we look at market expectations, it would not be unusual to see a growth of the Australian index. The RSI is in its middle zone at 56.70% while the price bell that has formed on the daily level is dual, and heavily weighted on the current price zone which is between highs and 7,392.34 points. If the triple top is breached we could see a new round of bullish sessions. But it is more likely to see a correction to 7,392.34 than the overcoming of such strong resistance.
Ion Jauregui - AT Analyst
*******************************************************************************************
The information provided does not constitute investment research. The material has not been prepared in accordance with the legal requirements designed to promote the independence of investment research and such should be considered a marketing communication.
All information has been prepared by ActivTrades ("AT"). The information does not contain a record of AT's prices, or an offer of or solicitation for a transaction in any financial instrument. No representation or warranty is given as to the accuracy or completeness of this information.
Any material provided does not have regard to the specific investment objective and financial situation of any person who may receive it. Past performance is not reliable indicator of future performance. AT provides an execution-only service. Consequently, any person acing on the information provided does so at their own risk.

AU200AUD to form a higher low?AU200AUD - 24h expiry
There is no clear indication that the upward move is coming to an end.
Although we remain bullish overall, a correction is possible with plenty of room to move lower without impacting the trend higher.
Risk/Reward would be poor to call a buy from current levels.
A move through 7800 will confirm the bullish momentum.
The measured move target is 7850.
We look to Buy at 7760 (stop at 7720)
Our profit targets will be 7860 and 7885
Resistance: 7800 / 7835 / 7850
Support: 7775 / 7760 / 7750
Risk Disclaimer
The trade ideas beyond this page are for informational purposes only and do not constitute investment advice or a solicitation to trade. This information is provided by Signal Centre, a third-party unaffiliated with OANDA, and is intended for general circulation only. OANDA does not guarantee the accuracy of this information and assumes no responsibilities for the information provided by the third party. The information does not take into account the specific investment objectives, financial situation, or particular needs of any particular person. You should take into account your specific investment objectives, financial situation, and particular needs before making a commitment to trade, including seeking advice from an independent financial adviser regarding the suitability of the investment, under a separate engagement, as you deem fit.
You accept that you assume all risks in independently viewing the contents and selecting a chosen strategy.
Where the research is distributed in Singapore to a person who is not an Accredited Investor, Expert Investor or an Institutional Investor, Oanda Asia Pacific Pte Ltd (“OAP“) accepts legal responsibility for the contents of the report to such persons only to the extent required by law. Singapore customers should contact OAP at 6579 8289 for matters arising from, or in connection with, the information/research distributed.
