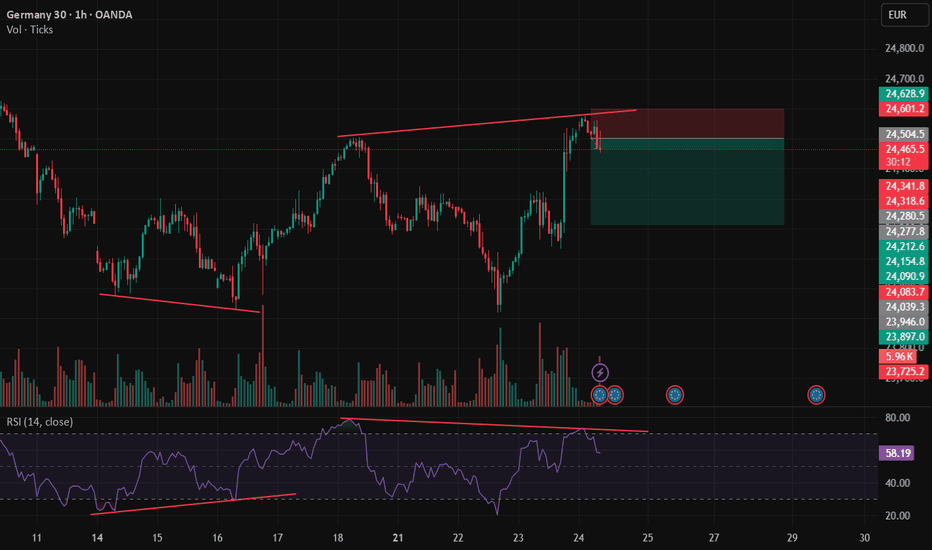
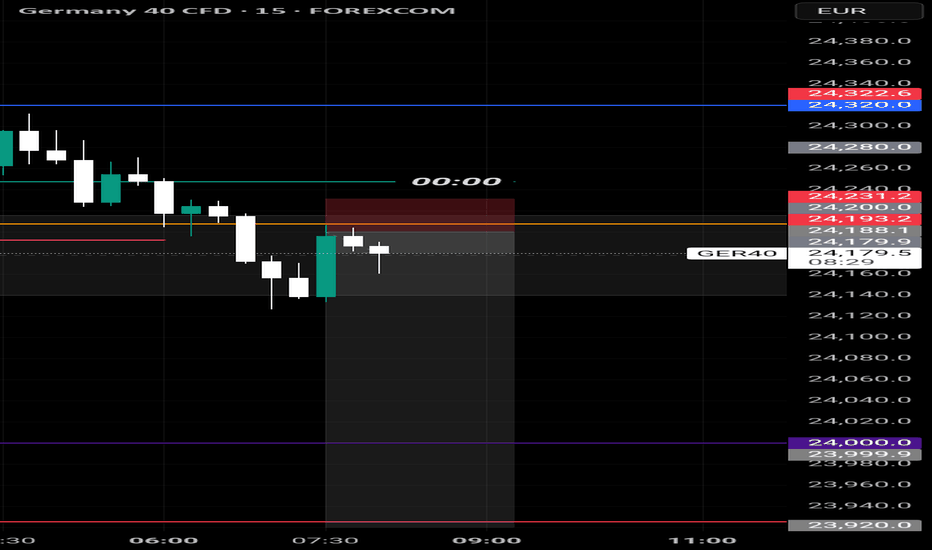
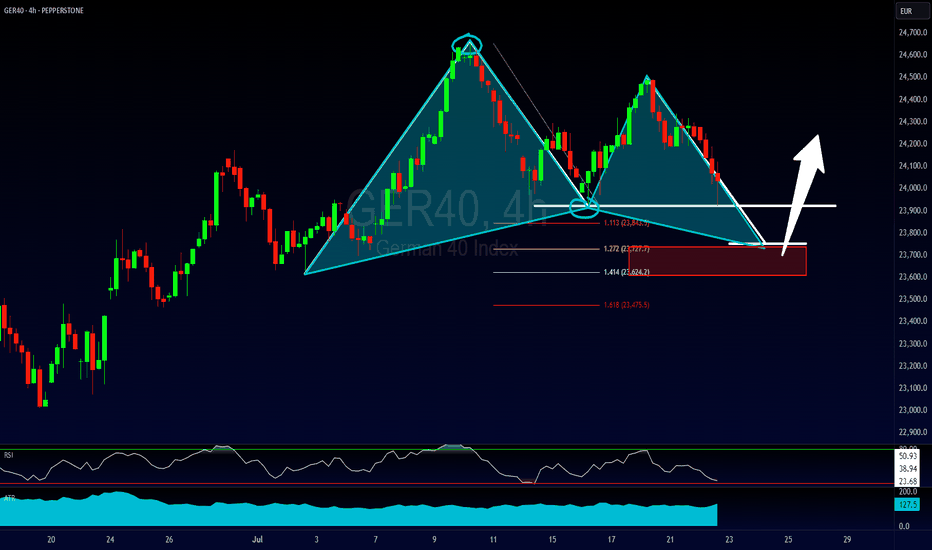
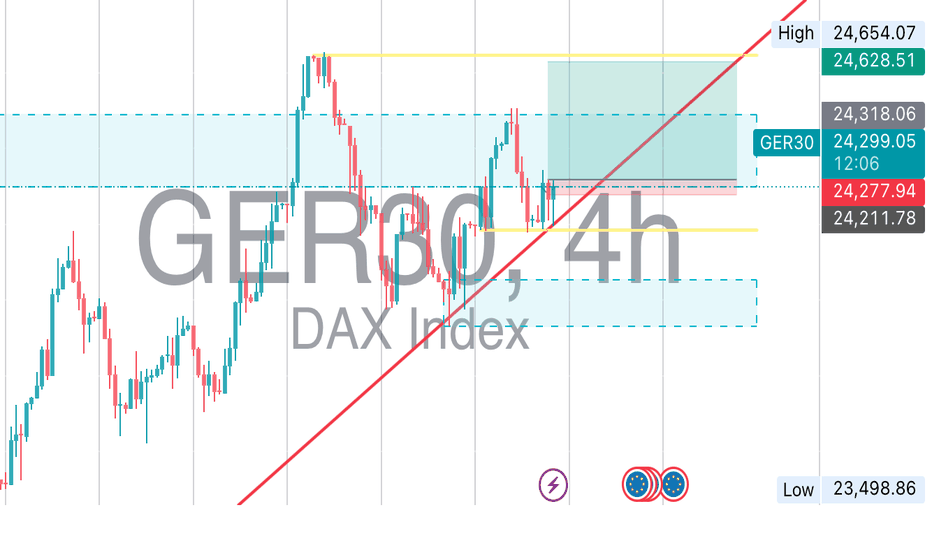
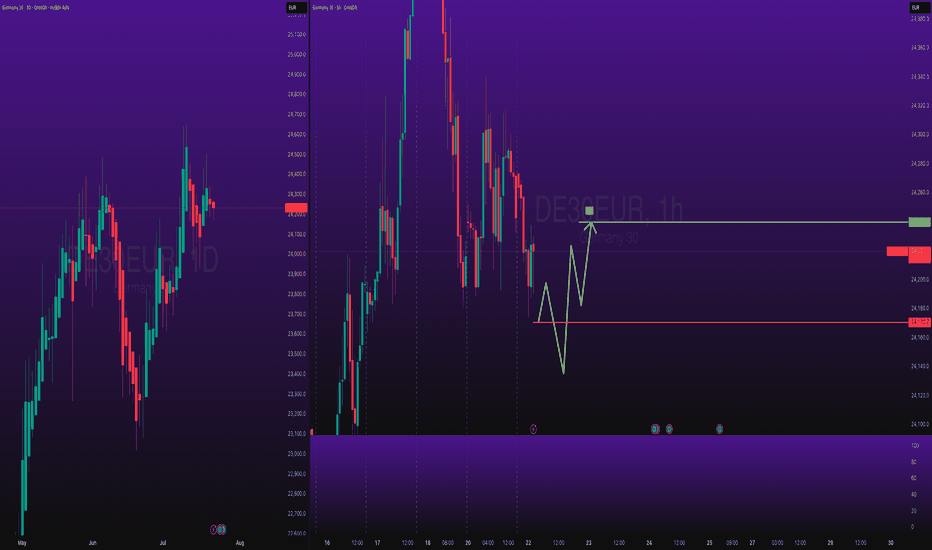
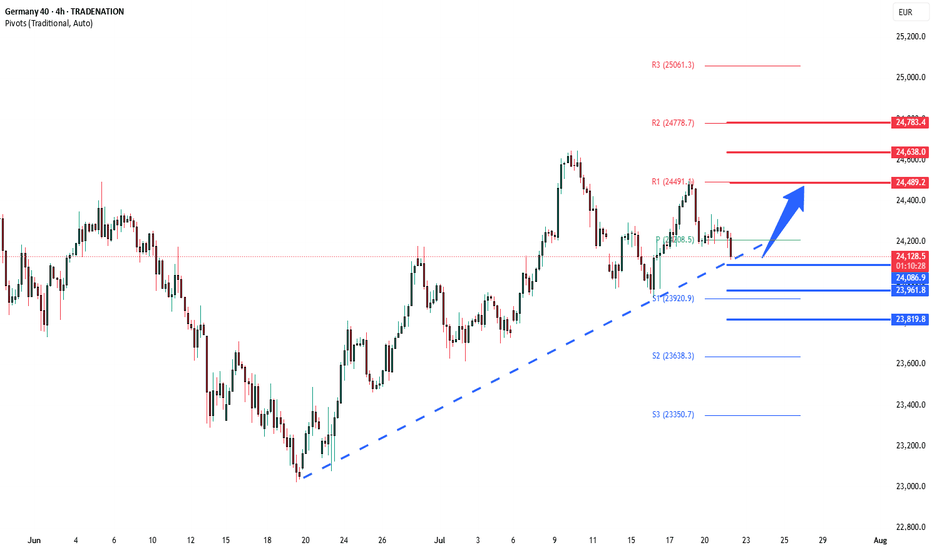
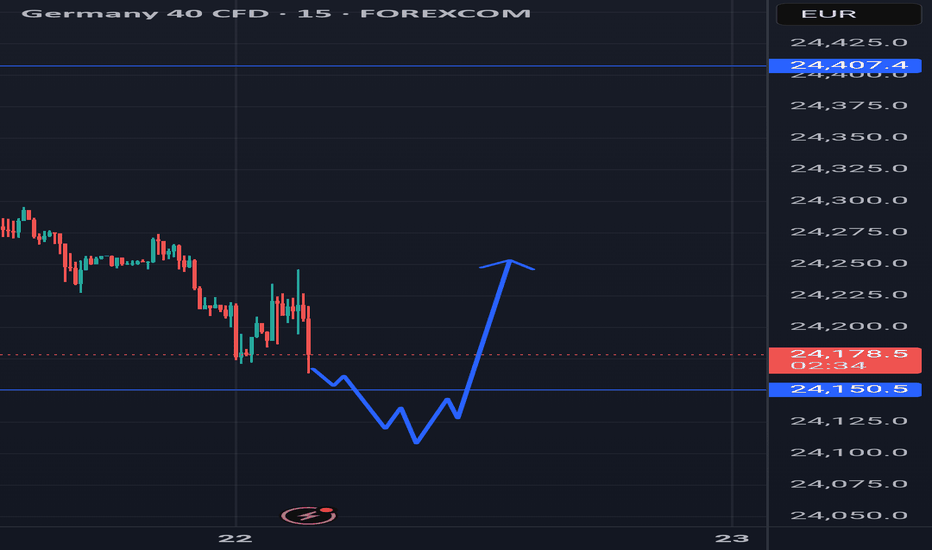
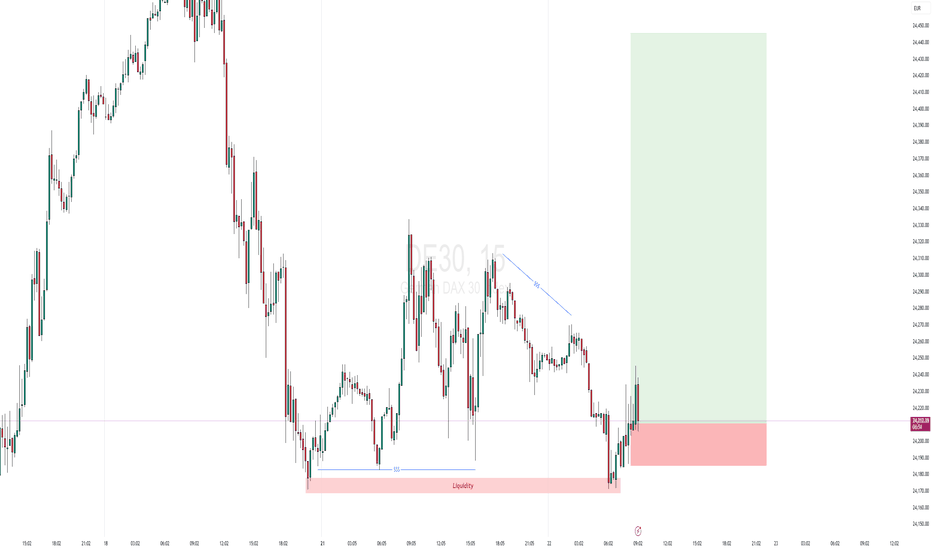
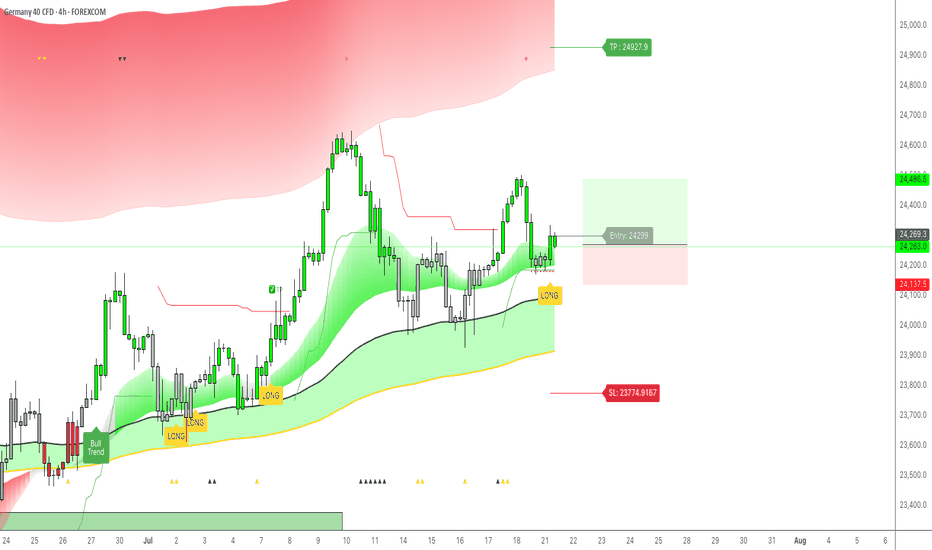
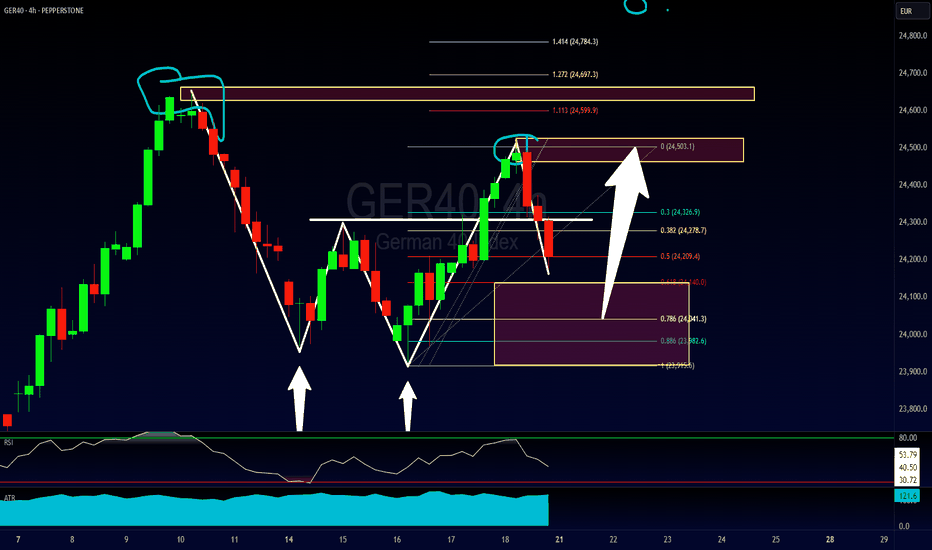
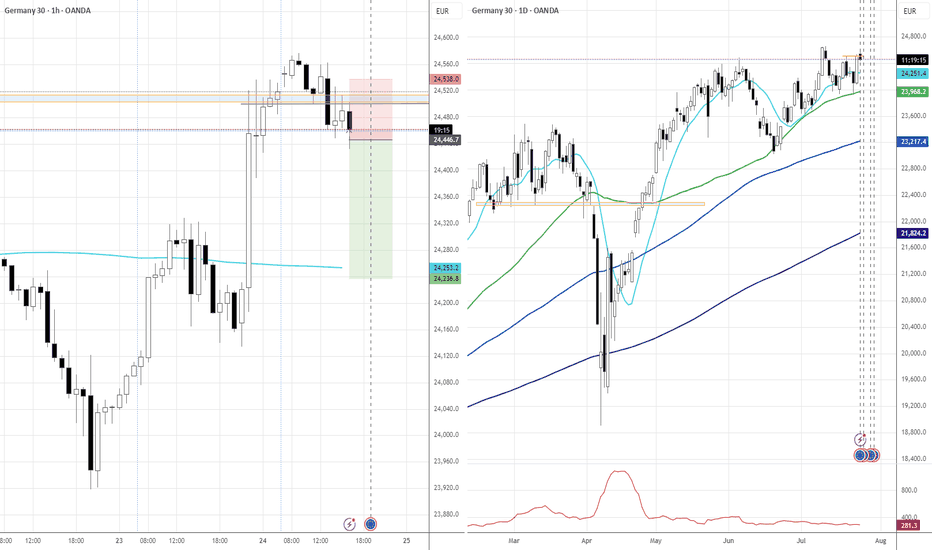
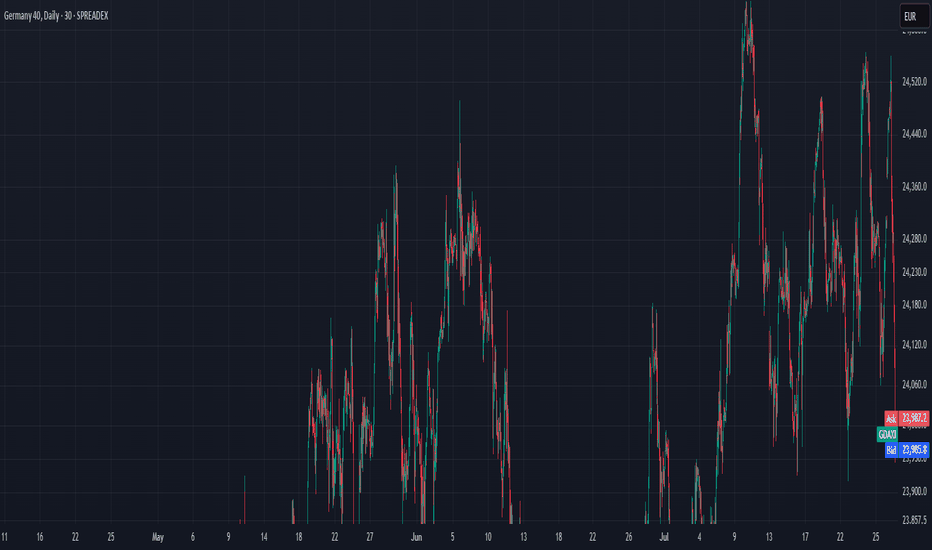
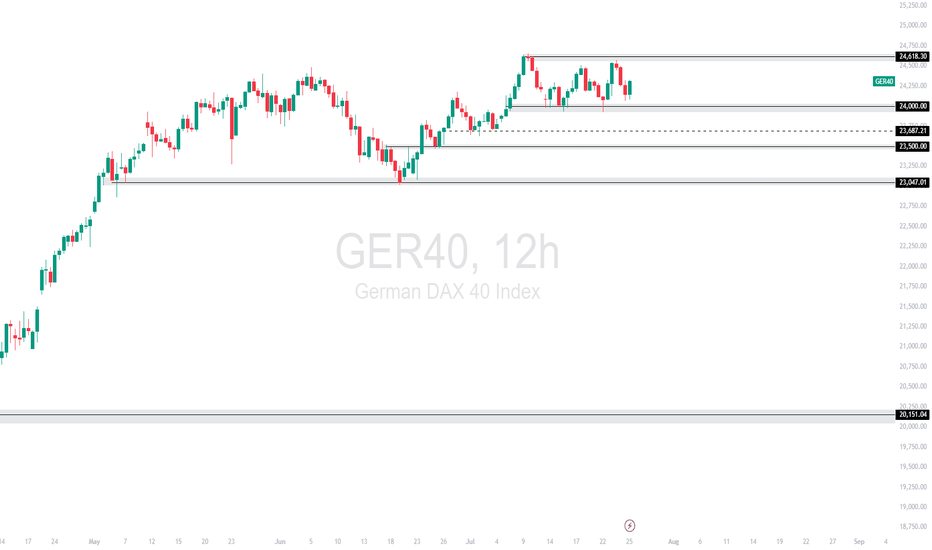
A high probability short setup on GER40! Hello traders,
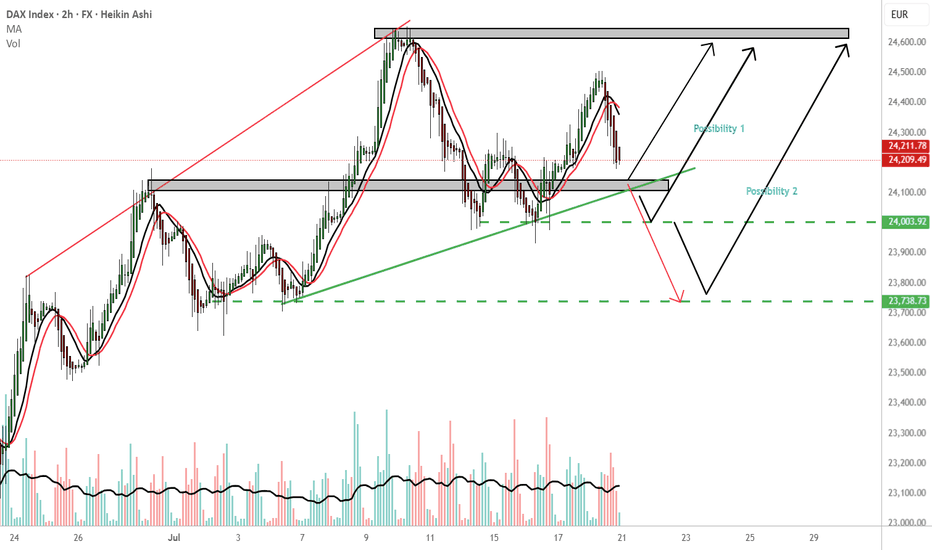
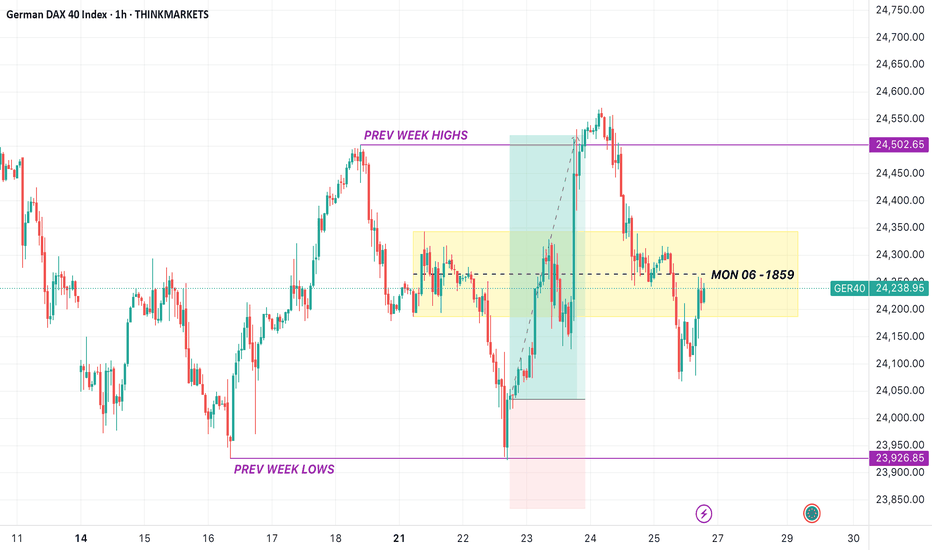
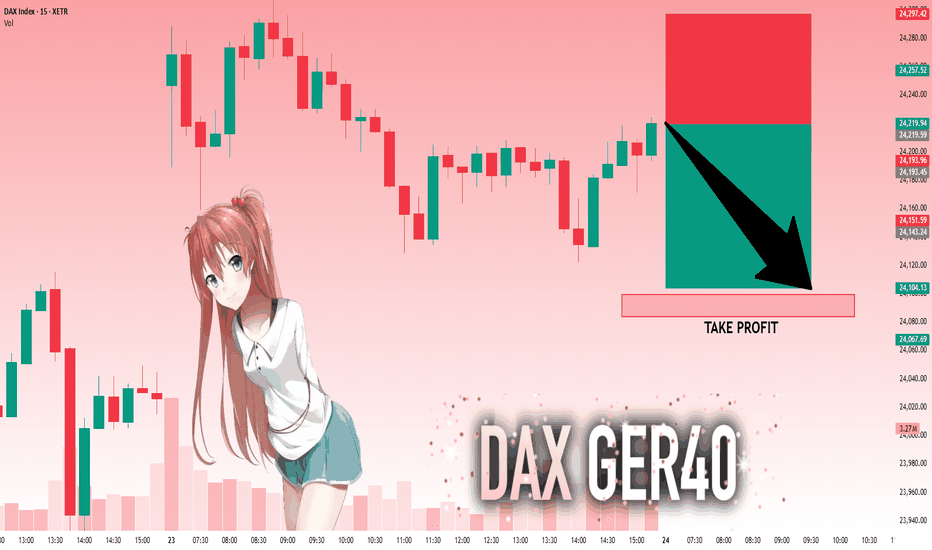
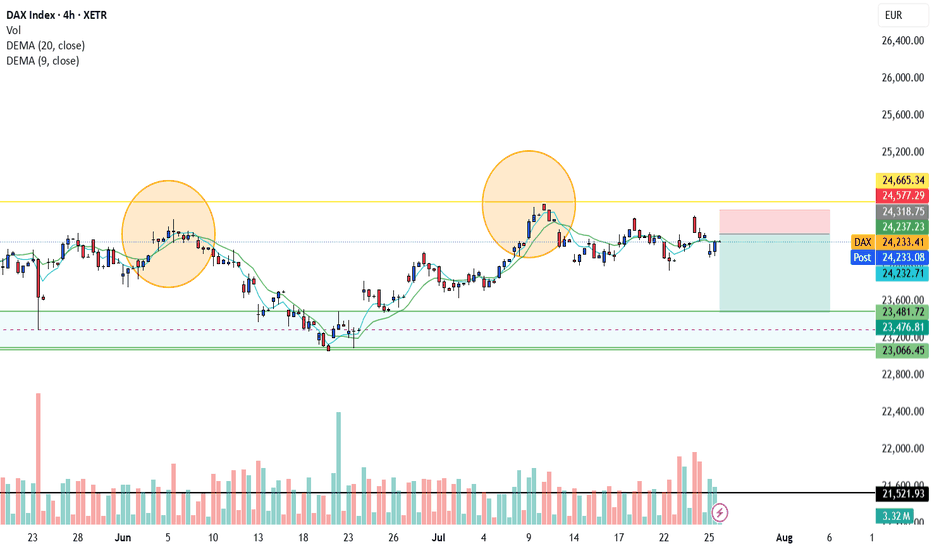
GER40 is flashing a prime shorting opportunity! On the higher timeframe, the index has formed a double top, a classic reversal pattern. The setup has been confirmed with a decisive neckline break, signaling strong bearish momentum.
I'm watching for a slight pullback to the neckline, where I'll be looking to enter short positions. My initial target is 21,637, with an extended move down to 21,112 if sellers maintain control.
Stay tuned for updates, and if you find this analysis valuable, give it a boost! Let’s catch this move together. 🚀🔥
GER30 trade ideas
DAX H4 | Downtrend to extend further?DAX (GER30) is rising towards a pullback resistance and could potentially reverse off this level to drop lower.
Sell entry is at 22,277.36 which is a pullback resistance that aligns with the 50.0% Fibonacci retracement.
Stop loss is at 22,640.00 which is a level that sits above an overlap resistance.
Take profit is at 21,746.73 which is a swing-low support that aligns close to the 78.6% Fibonacci projection.
High Risk Investment Warning
Trading Forex/CFDs on margin carries a high level of risk and may not be suitable for all investors. Leverage can work against you.
Stratos Markets Limited (www.fxcm.com):
CFDs are complex instruments and come with a high risk of losing money rapidly due to leverage. 63% of retail investor accounts lose money when trading CFDs with this provider. You should consider whether you understand how CFDs work and whether you can afford to take the high risk of losing your money.
Stratos Europe Ltd (www.fxcm.com):
CFDs are complex instruments and come with a high risk of losing money rapidly due to leverage. 63% of retail investor accounts lose money when trading CFDs with this provider. You should consider whether you understand how CFDs work and whether you can afford to take the high risk of losing your money.
Stratos Trading Pty. Limited (www.fxcm.com):
Trading FX/CFDs carries significant risks. FXCM AU (AFSL 309763), please read the Financial Services Guide, Product Disclosure Statement, Target Market Determination and Terms of Business at www.fxcm.com
Stratos Global LLC (www.fxcm.com):
Losses can exceed deposits.
Please be advised that the information presented on TradingView is provided to FXCM (‘Company’, ‘we’) by a third-party provider (‘TFA Global Pte Ltd’). Please be reminded that you are solely responsible for the trading decisions on your account. There is a very high degree of risk involved in trading. Any information and/or content is intended entirely for research, educational and informational purposes only and does not constitute investment or consultation advice or investment strategy. The information is not tailored to the investment needs of any specific person and therefore does not involve a consideration of any of the investment objectives, financial situation or needs of any viewer that may receive it. Kindly also note that past performance is not a reliable indicator of future results. Actual results may differ materially from those anticipated in forward-looking or past performance statements. We assume no liability as to the accuracy or completeness of any of the information and/or content provided herein and the Company cannot be held responsible for any omission, mistake nor for any loss or damage including without limitation to any loss of profit which may arise from reliance on any information supplied by TFA Global Pte Ltd.
The speaker(s) is neither an employee, agent nor representative of FXCM and is therefore acting independently. The opinions given are their own, constitute general market commentary, and do not constitute the opinion or advice of FXCM or any form of personal or investment advice. FXCM neither endorses nor guarantees offerings of third-party speakers, nor is FXCM responsible for the content, veracity or opinions of third-party speakers, presenters or participants.
Quarter Ends, Setup Begins: Long from DAX Support ZoneDAX returned to its major support zone around 22,000 after an extended decline through March. I’ve been triggered into a long position as we step into a fresh month and quarter. We’re sitting at strong historical demand with multiple macro events lined up this week—I’ll take what the market gives and manage it accordingly. No ego here, just flow with the setup. Let’s see where this one heads as NFP and PMI data come in.
Technicals
• Timeframe: 1H
• Entry Zone: Strong support retest at 22,000
• Setup: Long triggered on reaction from major support
• Target: Zone around 22,950
• SL: Below the support zone (~21,800)
• Fibcloud: Still trending below, watching for reclaim
• End-of-month rebalancing and Quarter close may add volatility.
Fundamentals
• DAX dropped nearly 2% on Monday, hitting its lowest levels since Feb 10, in line with global market weakness.
• US trade tariff uncertainty under Trump’s “reciprocal” rhetoric weighs on sentiment.
• Germany’s CPI eased to 2.2%, the lowest since Nov 2024, aligning with market expectations.
• Q1 performance remains strong overall, up nearly 11%, supported by Germany’s spending plan.
• Eyes on this week’s NFP and PMI data which could drive further price action.
Note: Please remember to adjust this trade idea according to your individual trading conditions, including position size, broker-specific price variations, and any relevant external factors. Every trader’s situation is unique, so it’s crucial to tailor your approach to your own risk tolerance and market environment.
Bullish rebound?DAX40 (DE40) has bounced off the pivot which is an overlap support and could rise to the 1st resistance.
Pivot: 21,775.24
1st Support: 21,501.86
1st Resistance: 22,374.35
Risk Warning:
Trading Forex and CFDs carries a high level of risk to your capital and you should only trade with money you can afford to lose. Trading Forex and CFDs may not be suitable for all investors, so please ensure that you fully understand the risks involved and seek independent advice if necessary.
Disclaimer:
The above opinions given constitute general market commentary, and do not constitute the opinion or advice of IC Markets or any form of personal or investment advice.
Any opinions, news, research, analyses, prices, other information, or links to third-party sites contained on this website are provided on an "as-is" basis, are intended only to be informative, is not an advice nor a recommendation, nor research, or a record of our trading prices, or an offer of, or solicitation for a transaction in any financial instrument and thus should not be treated as such. The information provided does not involve any specific investment objectives, financial situation and needs of any specific person who may receive it. Please be aware, that past performance is not a reliable indicator of future performance and/or results. Past Performance or Forward-looking scenarios based upon the reasonable beliefs of the third-party provider are not a guarantee of future performance. Actual results may differ materially from those anticipated in forward-looking or past performance statements. IC Markets makes no representation or warranty and assumes no liability as to the accuracy or completeness of the information provided, nor any loss arising from any investment based on a recommendation, forecast or any information supplied by any third-party.
DAX Bullish ReversalDAX Index (GER30) Trade Setup – 1H Chart Analysis
The DAX Index (GER30) is showing signs of a potential bullish reversal from a key support zone. The price has reacted at 21,975.87, indicating a possible upward move. A retracement to the **62% Fibonacci level (22,534.21) presents an optimal buy entry with a well-defined risk-to-reward ratio.
Trade Details:
- **Entry:** **22,534.21** (62% Fibonacci retracement)
- **Stop Loss (SL):** **21,975.87** (Below the recent swing low)
- **Take Profit Targets:**
- **TP1:** **23,476.14** (0% Fibonacci level)
- **TP2:** **24,056.53** (38.2% Fibonacci level)
- **TP3:** **24,995.45** (100% Fibonacci extension)
Analysis & Justification:
✔ Key Support Confirmation** – The price bounced off **21,975.87**, a significant support level.
✔ Fibonacci Confluence** – The 62% retracement level aligns with historical reaction zones.
✔ Moving Average Resistance** – A breakout above **22,600** could confirm bullish momentum.
✔ Risk-to-Reward Ratio** – The trade offers a **minimum 1.7:1 ratio**, improving with higher TP levels.
Paradigm Shift: Markets in Tension over Trump's New TariffsBy Ion Jauregui - Analyst at ActivTrades
The recent announcement of tariffs by Donald Trump's administration has generated a wave of uncertainty in financial markets. This measure could trigger a forceful response from the European Union, marking a paradigm shift in global trade and in the European bloc's economic strategy.
Reactions in Europe and the ECB
Christine Lagarde, President of the European Central Bank (ECB), has stressed the need for Europe to move towards greater economic independence. Her statements suggest that the EU will not back down from protectionist measures and that its fiscal and financial policy will have to adapt to this new global context.
It can be sensed from the statements that countries such as Germany and Italy, with a strong dependence on automotive exports, could be among the most affected. In addition, strategic sectors such as steel and aluminum would face an increase in production costs and possible interruptions in supply chains. Spain and Poland could be affected in the strategic raw materials sector as one of the most powerful net exporters in Europe. Especially Spain, given that it dedicates a large part of its aluminum exports to the North American country.
Economic and Financial Impact
A tariff-based trade war could slow growth, increase unemployment and generate a disinflationary or even deflationary environment not only in the United States but also in the European economic region. In this context, the bond market has begun to discount further interest rate cuts, reflecting declines in longer maturity yields and break-even inflation rates. Expectations of Europe, and even traditional allied countries Canada and its rapprochement with Europe, as well as Japan and Korea showing approaches to China, could be demarcating a red line for the White House in terms of its foreign policy form. What Trump will have to consider if the market begins to respond so negatively to such an “enemy of trade” attitude, and especially such a “bad friend” to his traditional allies. Another key factor to consider is the NATO-NATO section where Europe may eventually displace the US from the grouping.
DAX Analysis (Ticker AT: GER40)
The German index has started the Asian session with a sideways movement and 2 hours before the European opening there have been strong falls after the alliance comments in Asia. The situation of the index seems to have reached a floor around 22,241 points generating a possible support this Wednesday. If we look at the trend, the index has reached highs twice last month on March 6 and 18, marking on the second occasion a new milestone trading at 23,480.22 points, generating a return to a range where the index is comfortable this year between 22,918 points and 22,105 points, with the annual lows at 22,209.21 points. The current situation is indicating a possible golden crossover to reverse the current situation. The Current Control Point (POC) is located at 22,967.56 points, so it would not be unusual with the increase in volume and with an oversold RSI at 44.93%, it is possible that the index climbs to 22,522 points in its mid-range zone and try to pierce if the news accompanies the Euro zone and in particular Germany and the companies that make up the index. If this happens, we could see an advance to the upper part of the range slightly below the indicated checkpoint.
Future Outlook
If the Trump administration maintains its uncompromising trade strategy, pressure on European financial markets could intensify. The EU, for its part, will have to assess possible countermeasures to protect its economy and maintain stability in an increasingly challenging environment. At ActivTrades, we are closely following these developments and their impact on global markets.
*******************************************************************************************
The information provided does not constitute investment research. The material has not been prepared in accordance with the legal requirements designed to promote the independence of investment research and such should be considered a marketing communication.
All information has been prepared by ActivTrades ("AT"). The information does not contain a record of AT's prices, or an offer of or solicitation for a transaction in any financial instrument. No representation or warranty is given as to the accuracy or completeness of this information.
Any material provided does not have regard to the specific investment objective and financial situation of any person who may receive it. Past performance is not reliable indicator of future performance. AT provides an execution-only service. Consequently, any person acing on the information provided does so at their own risk.
DAX H4 | Rising into a swing-high resistanceThe DAX (GER30) is rising towards a swing-high resistance and could potentially reverse off this level to drop lower.
Sell entry is at 21,467.75 which is a swing-high resistance.
Stop loss is at 22,200.00 which is a level that sits above a pullback resistance.
Take profit is at 20,283.76 which is an overlap support that aligns with the 50.0% Fibonacci retracement.
High Risk Investment Warning
Trading Forex/CFDs on margin carries a high level of risk and may not be suitable for all investors. Leverage can work against you.
Stratos Markets Limited (tradu.com):
CFDs are complex instruments and come with a high risk of losing money rapidly due to leverage. 63% of retail investor accounts lose money when trading CFDs with this provider. You should consider whether you understand how CFDs work and whether you can afford to take the high risk of losing your money.
Stratos Europe Ltd (tradu.com):
CFDs are complex instruments and come with a high risk of losing money rapidly due to leverage. 63% of retail investor accounts lose money when trading CFDs with this provider. You should consider whether you understand how CFDs work and whether you can afford to take the high risk of losing your money.
Stratos Global LLC (tradu.com):
Losses can exceed deposits.
Please be advised that the information presented on TradingView is provided to Tradu (‘Company’, ‘we’) by a third-party provider (‘TFA Global Pte Ltd’). Please be reminded that you are solely responsible for the trading decisions on your account. There is a very high degree of risk involved in trading. Any information and/or content is intended entirely for research, educational and informational purposes only and does not constitute investment or consultation advice or investment strategy. The information is not tailored to the investment needs of any specific person and therefore does not involve a consideration of any of the investment objectives, financial situation or needs of any viewer that may receive it. Kindly also note that past performance is not a reliable indicator of future results. Actual results may differ materially from those anticipated in forward-looking or past performance statements. We assume no liability as to the accuracy or completeness of any of the information and/or content provided herein and the Company cannot be held responsible for any omission, mistake nor for any loss or damage including without limitation to any loss of profit which may arise from reliance on any information supplied by TFA Global Pte Ltd.
The speaker(s) is neither an employee, agent nor representative of Tradu and is therefore acting independently. The opinions given are their own, constitute general market commentary, and do not constitute the opinion or advice of Tradu or any form of personal or investment advice. Tradu neither endorses nor guarantees offerings of third-party speakers, nor is Tradu responsible for the content, veracity or opinions of third-party speakers, presenters or participants.
DAX IMPORTANT resistance retest at 21520? The DAX40 continues to exhibit bearish sentiment, aligning with the prevailing downward trend. Recent price action suggests that the index experienced an oversold rally, which was subsequently rejected near a key resistance zone — the previous intraday consolidation level around 21,520.
This area now serves as a critical pivot point. A failure to break above 21,520, followed by renewed selling pressure, would likely confirm a bearish reversal, with downside targets at:
20,333 – Near-term support
19,557 – Medium-term support
18,780 – Long-term support level
However, if price breaks and closes firmly above 21,520 on a daily basis, the bearish scenario would be invalidated. In that case, the DAX40 could extend gains toward:
21,880 – Immediate resistance
22,330 – Major upside target
Conclusion
The bias remains bearish below 21,520, with rallies into that level offering potential short opportunities. A daily close above 21,520, however, would shift sentiment and open the door for bullish continuation toward higher resistance levels.
This communication is for informational purposes only and should not be viewed as any form of recommendation as to a particular course of action or as investment advice. It is not intended as an offer or solicitation for the purchase or sale of any financial instrument or as an official confirmation of any transaction. Opinions, estimates and assumptions expressed herein are made as of the date of this communication and are subject to change without notice. This communication has been prepared based upon information, including market prices, data and other information, believed to be reliable; however, Trade Nation does not warrant its completeness or accuracy. All market prices and market data contained in or attached to this communication are indicative and subject to change without notice.
Technical Analysis WeeklyStart your week by identifying the key price levels and trends.
The SpreadEx Research team has analysed the most popular markets, including stocks, indices, commodities & forex.
--------------------------------------------------------------------------------------------------------------
Analysis
Germany 40 remains in a bearish market but has entered a correction following last week’s big turnaround. It is trading at 20,805, still below its 20-day VWAP of 21,478. The RSI at 43 suggests weak momentum, but not extreme oversold conditions. Support is in place at 19,120, while a breakout above resistance at 23,836 would be needed to challenge the current trend.
UK 100 is in a bearish correction phase, hovering at 8,105 and just under the VWAP of 8,147. With an RSI of 42, momentum remains muted but no longer extremely weak. Support is seen at 7,428, and resistance looms at 8,865.
Wall Street continues to correct within a broader bearish trend. It trades at 40,409, slightly below the VWAP of 40,734. RSI at 48 indicates neutral momentum, showing signs of consolidation. Key support is found at 37,241, while resistance stands at 44,228.
Brent Crude is in a bearish impulsive move, with price down to 6,445, firmly beneath the VWAP of 6,895. RSI at 39 signals persistent bearish pressure. Immediate support lies at 5,964, and resistance caps upside potential way back up at 7,826.
Gold continues to show strength, advancing in an impulsive bullish trend to yet more record highs. It trades at 3,231, above its VWAP of 3,084. The RSI at 69 places it just shy of overbought levels, suggesting momentum remains strong. Support rests at 2,921, while resistance is close at 3,231.
EUR/USD is surging in a bullish impulsive phase, trading at 1.1392 and significantly above its VWAP of 1.0955. RSI is elevated at 75, indicating overbought territory and scope for some kind of consolidation. Support is located at 1.0543, and price is currently testing resistance at 1.1392.
GBP/USD continues its impulsive bullish move, currently trading at 1.3130, just above the VWAP of 1.2940. RSI at 63 reflects solid bullish momentum. Support sits at 1.2733, while resistance coincides with the current high at 1.3130.
USD/JPY is in a bearish impulsive move, trading at 142.73, beneath the VWAP of 147.65. The RSI at 34 suggests weakening momentum, close to oversold but not extreme. Support is nearby at 142.43, with resistance up at 153.06.
DE30 The DE30 is my favorite indicator.
The overall trend is bullish.
You can review the previous analysis, and the trends will become clearer, especially the last analysis, which was below 20,000 points, with a target of 23,500, which has already been achieved.
Now, after the decline, the uptrend has resumed, and with each break of the line, the next target is targeted.
We will closely monitor other markets and provide updates.
DAX daily Imbalance Chart Structure & Pattern
The DAX was previously moving within a clear ascending channel, indicating bullish momentum.
A breakdown of this ascending structure has led to a sharp selloff.
Price is now reacting to strong historical demand zones, marked by purple horizontal boxes.
📉 Price Action & Market Behavior
Current price: 19,988.34 EUR
There was a massive drop from the highs around 23,000 EUR to nearly 18,000 EUR.
Today’s candle shows a strong bullish wick, suggesting a bounce off the 18,800–19,200 support zone.
Volume is extremely elevated, indicating capitulation or aggressive repositioning.
📊 RSI (Relative Strength Index)
Current RSI: 27.52 — deeply in oversold territory, which often precedes short-term rebounds or consolidation phases.
If RSI crosses back above 30, that could be a buy trigger for counter-trend traders.
🔍 Key Levels to Watch
Immediate Resistance:
20,800
21,200
Support Zones:
19,200 – 18,800 (currently bouncing from here)
18,000 – 17,600 (next level if current support fails)
📈 Trade Setups
1. Short-Term Rebound / Relief Rally (Bullish Idea):
Entry: Around 19,900–20,000 (after confirmation of support holding)
Target 1: 20,800
Target 2: 21,200
Stop Loss: Below 19,200
2. Bearish Continuation (If support breaks):
Entry: Break below 18,800 with volume
Target: 18,000
Stop Loss: Above 19,300
🧠 Summary
The DAX has sharply broken its bullish structure and is now in a correction phase.
Current bounce from oversold RSI and support zone may give a temporary rally.
However, the overall trend has shifted bearish, and a lower high or failed bounce could trigger further downside.
It's a key inflection point — great for active traders watching for a bounce vs breakdown confirmation.
DAX Stock Chart Fibonacci Analysis 040525Trading Idea
1) Find a FIBO slingshot
2) Check FIBO 61.80% level
3) Entry Point > 20,427/61.80%
Chart time frame: C
A) 15 min(1W-3M)
B) 1 hr(3M-6M)
C) 4 hr(6M-1year)
D) 1 day(1-3years)
Stock progress: C
A) Keep rising over 61.80% resistance
B) 61.80% resistance
C) 61.80% support
D) Hit the bottom
E) Hit the top
Stocks rise as they rise from support and fall from resistance. Our goal is to find a low support point and enter. It can be referred to as buying at the pullback point. The pullback point can be found with a Fibonacci extension of 61.80%. This is a step to find entry level. 1) Find a triangle (Fibonacci Speed Fan Line) that connects the high (resistance) and low (support) points of the stock in progress, where it is continuously expressed as a Slingshot, 2) and create a Fibonacci extension level for the first rising wave from the start point of slingshot pattern.
When the current price goes over 61.80% level , that can be a good entry point, especially if the SMA 100 and 200 curves are gathered together at 61.80%, it is a very good entry point.
As a great help, tradingview provides these Fibonacci speed fan lines and extension levels with ease. So if you use the Fibonacci fan line, the extension level, and the SMA 100/200 curve well, you can find an entry point for the stock market. At least you have to enter at this low point to avoid trading failure, and if you are skilled at entering this low point, with fibonacci6180 technique, your reading skill to chart will be greatly improved.
If you want to do day trading, please set the time frame to 5 minutes or 15 minutes, and you will see many of the low point of rising stocks.
If want to prefer long term range trading, you can set the time frame to 1 hr or 1 day.
DAX reached upper limit of rising wedge - reversal possibleWhen in doubt - zoom out
On Thursday and Friday the DAX / GDAXI reached a high of 21800. Could this be a potential top ?
Looking at the W and M chart (log) the DAX (XETRA) has been trading in a rising wedge since 2003.
With reaching the 21800 level, the DAX has touched the upper line of this rising wedge again. The last time was in April 2015.
The monthly MACD (5 30) has never been this high and the last time the RSI was this high (77) was in 2015 and 2007.
Zooming in on the 5 minute chart (GDAXI), price touched the 21790-21800 region five times in the last two trading days, fell below the current trend line (since Jan 13th), retested it and was rejected to the downside.
There are no certainties in the stock market, but this being at least a local top is quite probable.
DAX40 INTRADAY corrective pullback capped at 22144The DAX 40 remains in a bearish trend, with recent price action suggesting an oversold bounce rather than a structural reversal.
Key Levels & Scenarios
Resistance: 22144 (previous intraday consolidation zone)
A bearish rejection from this level could resume downside momentum.
Support targets: 21544, followed by 21300 and 21000 over a longer timeframe.
Bullish Breakout Scenario:
A confirmed breakout above 22144 with a daily close above this level would invalidate the bearish outlook.
Upside targets: 22385 (next resistance), followed by 22685.
Indicators & Market Sentiment
RSI suggests the market was oversold, leading to the current bounce.
Volume analysis indicates weak bullish momentum, reinforcing the bearish bias unless 22144 is breached.
Conclusion
The prevailing bearish trend remains intact unless DAX 40 breaks and holds above 22144. Traders should watch for bearish rejection at this level for downside continuation or a daily close above 22144 for a shift to bullish momentum.
This communication is for informational purposes only and should not be viewed as any form of recommendation as to a particular course of action or as investment advice. It is not intended as an offer or solicitation for the purchase or sale of any financial instrument or as an official confirmation of any transaction. Opinions, estimates and assumptions expressed herein are made as of the date of this communication and are subject to change without notice. This communication has been prepared based upon information, including market prices, data and other information, believed to be reliable; however, Trade Nation does not warrant its completeness or accuracy. All market prices and market data contained in or attached to this communication are indicative and subject to change without notice.
DAX – 60-Minute Chart AnalysisLet’s see if this Elliott Wave count plays out as anticipated.
🔸 Invalidation Level: 22,716.4 (CFD – GER40, Capital.com)
🔸 Downside Targets: 21,752 and 21,612
A sustained move above the invalidation level would negate the current bearish wave structure, while continued weakness below recent swing highs keeps the downside scenario in play.
Trading GER30 on Tariff DayToday will be a big day for the stock market in 2025. The tariffs to be implemented promises to either make or break the market.
Last week we saw a massive sell off and on Monday and Tuesday we have seen the markets gain a decent amount. However here is what needs to be noted for all indexes:
1) The Daily downtrend is intact
2) The H4 MA is pointing down
3) On GER30,we see a bat pattern to sell
4) H1, M30, M15 is OB and has a double top
We should not follow the news, but instead focus on the charts. Based on this, we will enter a short position and expect the market to resume the downtrend.
Stop loss will be 200 pips around 25700. Good luck!
GER40 (DAX 40) AnalysisThe German DAX 40 index (GER40) recently tested key support around 22,063.63 and exhibited a bullish reaction.
📈 Bullish Scenario:
If GER40 sustains above 22,063.63, it may push towards the 22,775.84 resistance zone.
A break above 22,775.84 could open the way for a break and retest, potentially leading to a continuation towards the 23,395.75 resistance level.
📉 Bearish Scenario:
If the price fails to hold above 22,063.63, further downside towards 21,231.97 may be observed.
⚠ Risk Disclaimer: This analysis is for informational purposes only and does not constitute financial advice or a trading signal. Market conditions can change rapidly, especially in light of recent geopolitical developments. Always confirm market conditions using your own strategy before making any trading decisions.
4-hr Germany 40: Price Meets Important Resistance in Down TrendOver the past week, the DAX has experienced a sharp decline, plunging by an astonishing 3,400 points. This downward movement is not isolated, as its international counterparts, such as the UK100 and US100, are also facing significant losses. This widespread market downturn suggests a prevailing risk-off sentiment among investors.
Given the current conditions, we anticipate a further decline of approximately 700 points. Our outlook is reinforced by the appearance of the "death cross," a well-known technical pattern signaling a bearish trend. Historically, this formation has been a reliable indicator of continued selling pressure.
To capitalize on this movement, we executed a sell trade at 22,490, a key level coinciding with the 38% Fibonacci retracement. This level has repeatedly acted as strong resistance in previous market cycles, making it a strategic entry point for our trade.
Considering the heightened market volatility, we have implemented a stop-loss (SL) with a 2% buffer from our entry price. This allows for some flexibility while mitigating excessive risk. By combining technical analysis with prudent risk management, we aim to navigate the ongoing bearish momentum effectively.
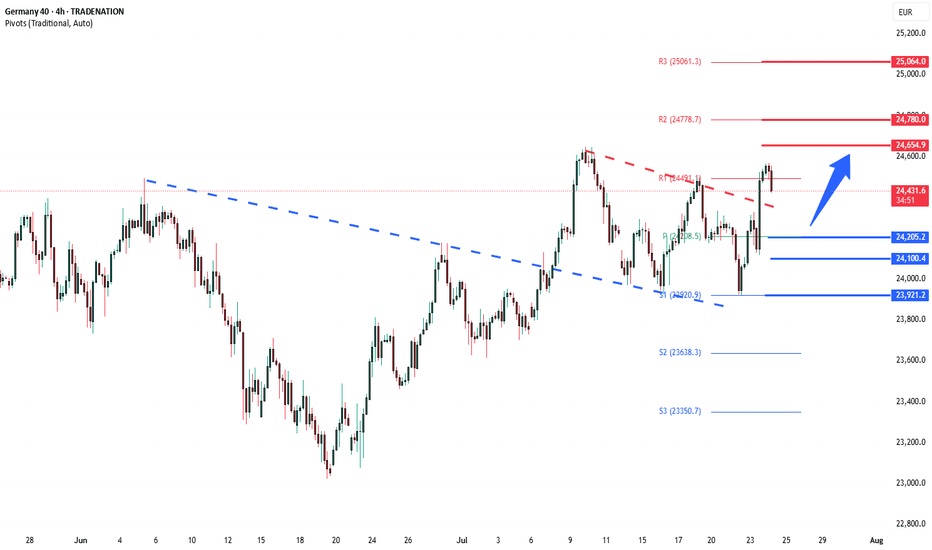
DAX INTRADAY at crossroads awaits US tariffs The DAX40 continues to exhibit bullish sentiment, breaking out from a period of sideways consolidation and pushing toward previous resistance and all-time highs (ATH). The prevailing uptrend supports further upside potential, with key resistance levels in focus.
Key Support and Resistance Levels
Resistance Level 1: 23,446
Resistance Level 2: 23,815
Resistance Level 3: 24,000 - 24,420
Support Level 1: 22,575
Support Level 2: 22,204
Support Level 3: 21,814
Conclusion:
The positive reaction to fiscal spending plans and geopolitical developments reinforces the bullish sentiment for DAX40. A sustained move above the nearest resistance at 23,446 could pave the way toward higher targets, while holding above support at 22,575 is crucial to maintaining the uptrend.
This communication is for informational purposes only and should not be viewed as any form of recommendation as to a particular course of action or as investment advice. It is not intended as an offer or solicitation for the purchase or sale of any financial instrument or as an official confirmation of any transaction. Opinions, estimates and assumptions expressed herein are made as of the date of this communication and are subject to change without notice. This communication has been prepared based upon information, including market prices, data and other information, believed to be reliable; however, Trade Nation does not warrant its completeness or accuracy. All market prices and market data contained in or attached to this communication are indicative and subject to change without notice.