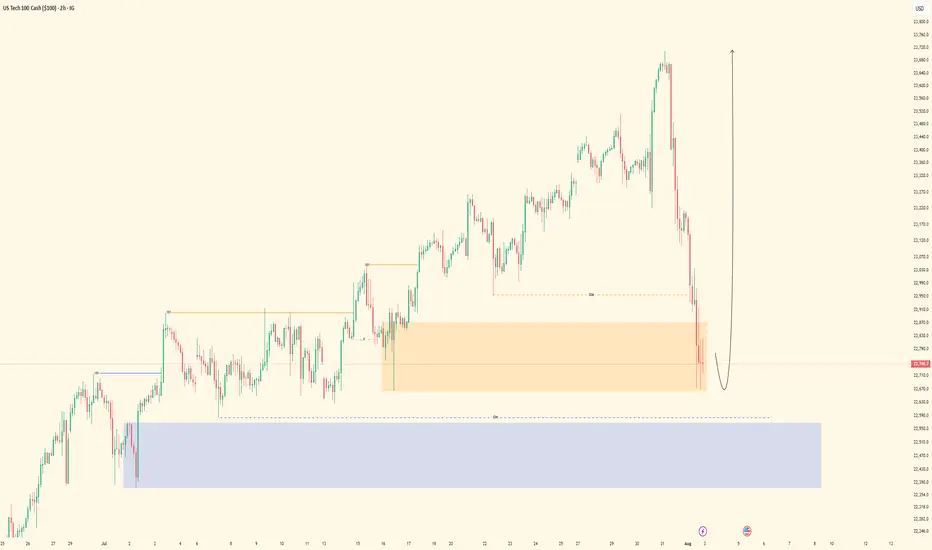
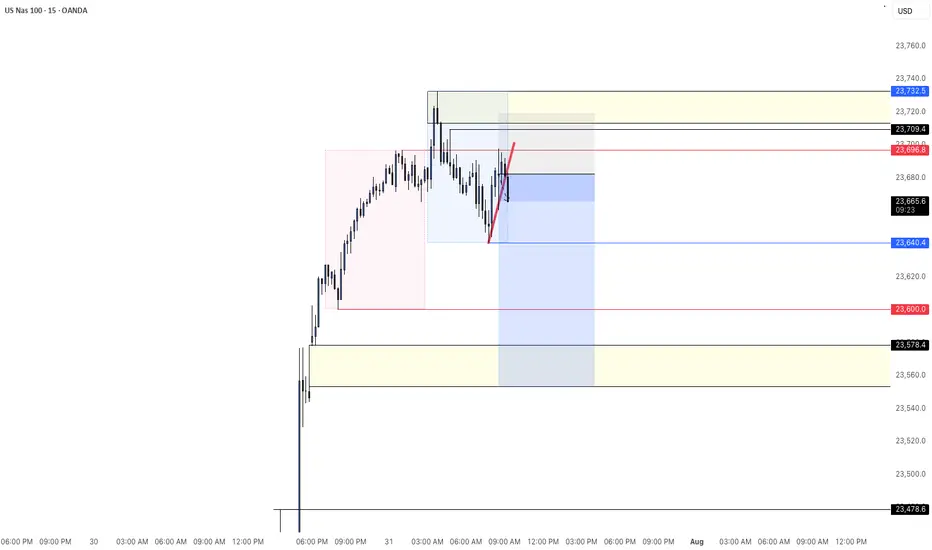
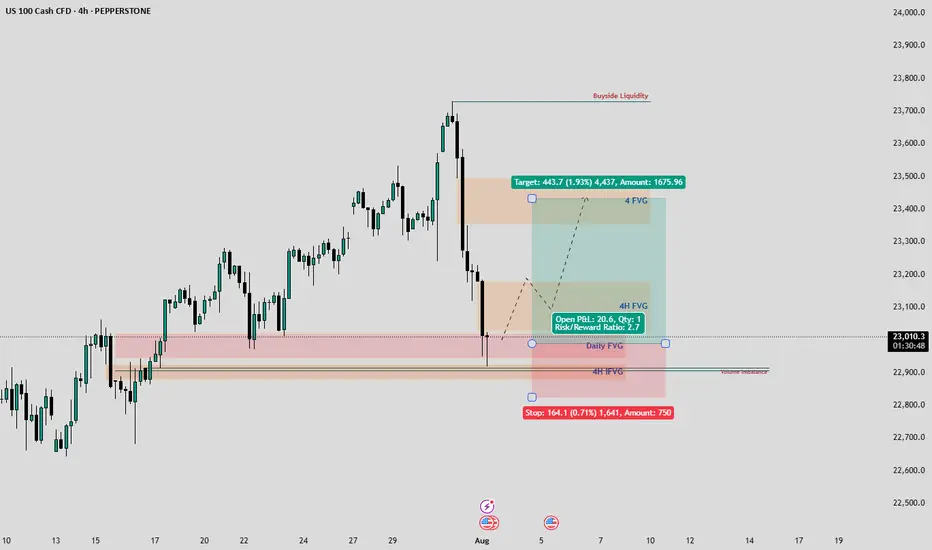
SWING TRADE NASDAQIs this another case of Trump moving the markets so his buddies can get better entries? 👀
Not saying anything... but July candles were way too friendly in that yellow box. Institutions were loading up like it was Black Friday.
I jumped in too—snagged a clean 10RR 😎📈
Now, with seasonality (August 3.5% average past 10 years) + Commitment of traders data backing me up( July COT is heavy longs), I’m risking light for a tiny 27RR setup.
Will it work? No clue.
Will I be dramatic about it? Absolutely. 🎭📉📈
NAS100 trade ideas
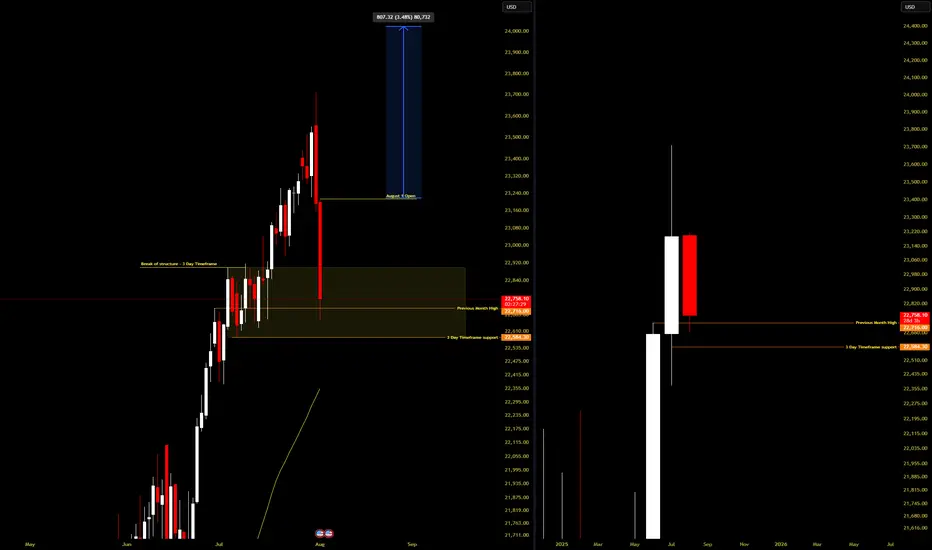
We Got The Deal - Time To Sell The NewsOkay, so we have the long-awaited deal between the US and the EU. After a large up-gap was announced last night, it now seems as if a “sell the facts” scenario is unfolding.
Such a wave of selling would also fit in well with the typical seasonal weakness that we often see in the markets from August onwards.

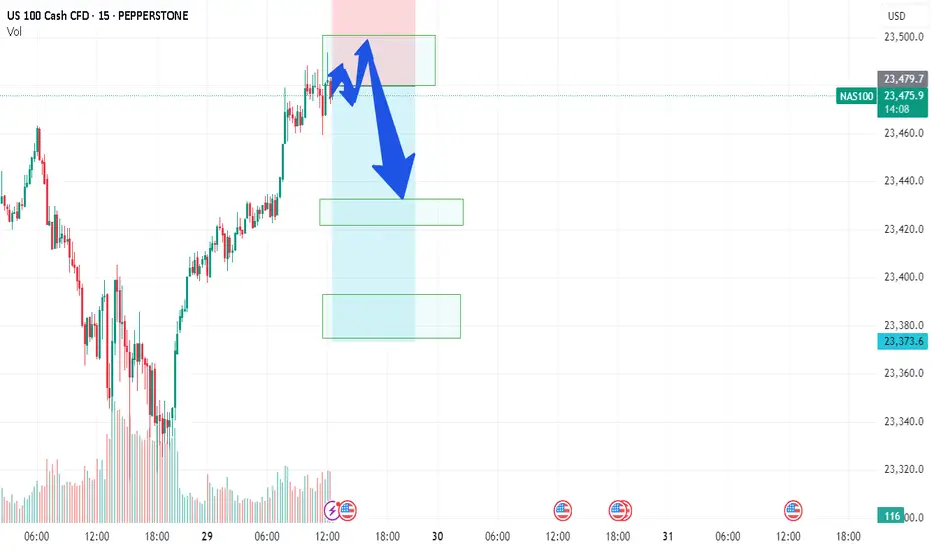
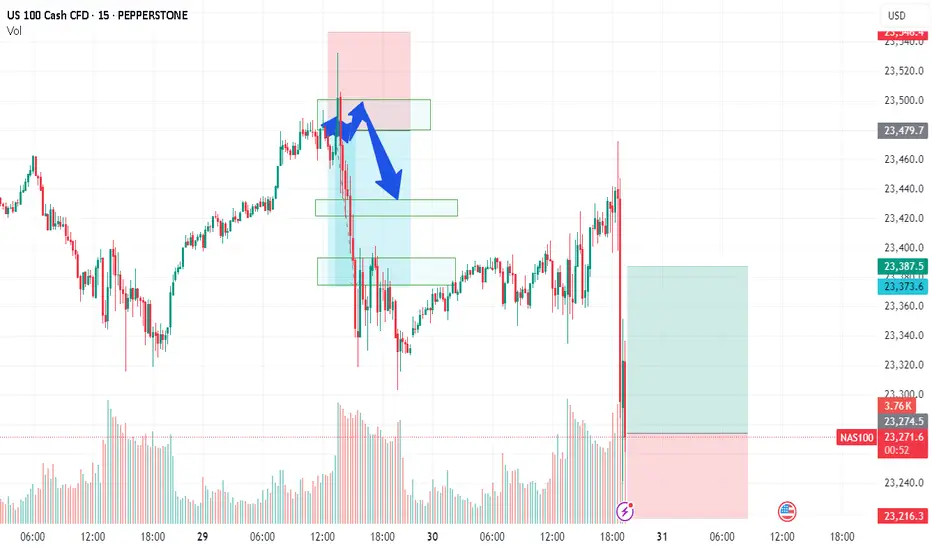
NAS/TEC100 - LETS GET NASTY ON NAS100Team, NAS currently sitting at 23480, before the US market open
however during the market open, please be aware of the volatility that may hit your stop loss
You have 2 options to trade on this NAS- NASTY
Option 1: wait for market open, if it hits 23500-23515 - then short with stop loss at 23580
Option 2: Short at the current market with small volume - and if the market open with volatile, you can take another advantage of shorting more volume as per option 1 instructed.
OK, pick your strategy! do NOT be shy.
I am going to have small short position and will consider adding more during US market opening after 5-10 minutes, much easier to see the direction of the market - we do LIVE trading everyday. Please note: if NAS fall below 23450-40 bring stop loss to BE (Break even)
1st TARGET range: 23435-23416 - make sure take 70% volume
2nd target at 23390 to 23376
Why do I short on NAS when tomorrow rate decision, i think this quarter report, market will not be the same as last quarter, even rate cut!
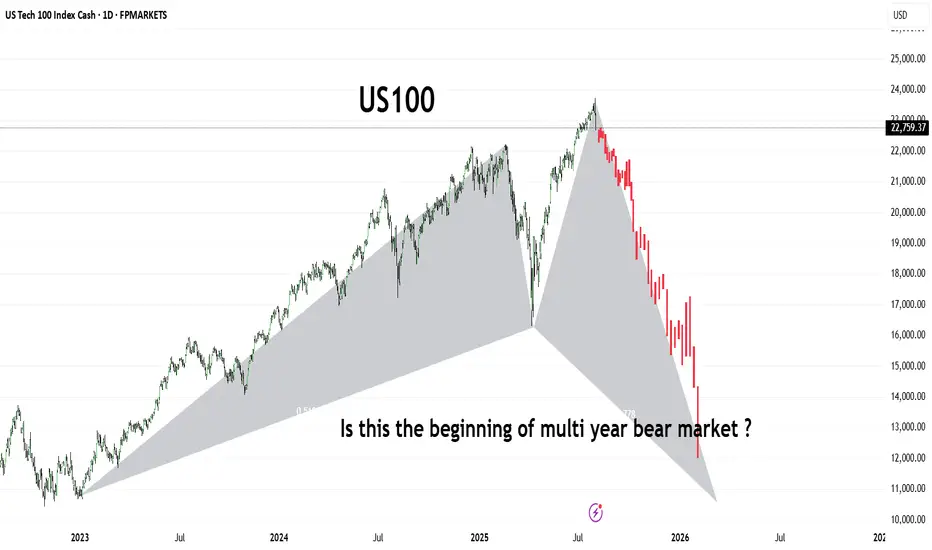
US100The US100 (Nasdaq 100) has shown a dramatic shift in trend, forming what appears to be a large-scale bearish harmonic pattern or potential M-top structure. After reaching its peak in mid-2025, the index has entered a sharp downward trajectory, shedding significant value in a short span.
This chart raises a critical question for long-term investors and traders:
Are we witnessing the early phase of a prolonged bear market that could stretch into 2026 and beyond?
🔻 Key Observations:
Bearish structure developing with aggressive selling pressure.
Potential breakdown from long-term support trendlines.
Momentum suggests institutional risk-off behavior.
Stay alert for macroeconomic cues, interest rate policy, and earnings season signals. A break below 13,000 could confirm a deeper bear cycle
NAS100 - Potential TargetsDear Friends in Trading,
How I see it,
I know I'm posting the same old overbought pattern...
"I think I found a background I like at last - Just Testing"
1) A previously discussed we will notice a "SIGNAL" Type candle
2) It can be on 1HR-4HR-1D TF
3) Today is FOMC and Friday NFP
These two events will for sure give us the signals we need to clarify
the way forward
Let this very important week play out, I'll touch base again next week
I sincerely hope my point of view offers a valued insight
Thank you for taking the time study my analysis.

NAS100 - SHORTPrice hit TP after yesterday's long position. Created new all time highs into the asian/London session. We have a nice gap I will target as my potential full TP.
US100 makes a slight drop from ATH!Price dropped from the all time high of 23,703 we’re beginning to see a pullback in price. We’d be monitoring a time price will shift from intraday bearish to bullish. This is to help us position ourselves for a buy opportunity.
Trend Exhaustion Detected – Bearish Structure AheadUS100 (NASDAQ) 30-minute chart as of July 26, 2025, with technical insights based on the visible elements.
🔍 1. Trend Analysis
Primary Trend: Uptrend (bullish structure)
The price has been respecting a rising parallel channel, marked by:
Ascending support (lower boundary)
Ascending resistance (upper boundary)
Market structure shows:
Higher Highs (HH)
Higher Lows (HL)
✅ This indicates continuation of bullish momentum until structure breaks.
📐 2. Market Structure Elements
Structure Type Label on Chart Price Zone (approx.)
Break of Structure (BOS) BOS (center-left) ~22,950
Higher Low (HL) HL (2x) ~22,700 (1st), ~23,050 (2nd)
Higher High (HH) HH (2x) ~23,150 and ~23,300
Resistance Labelled ~23,300–23,320
Demand Zones Labelled ~22,450–22,700
🔁 Break of Structure (BOS)
The BOS occurred after a prior swing low was broken, followed by a new higher high, confirming a bullish shift.
🧱 3. Support / Resistance Analysis
🔼 Resistance Zone
The price is testing strong resistance around 23,300–23,320
Multiple rejections in this area
Trendline resistance also aligns here
A rejection arrow is drawn, indicating potential bearish reaction
🔽 Support Zone (Immediate)
23,180–23,220: highlighted green box is a local support block
If broken, likely to revisit 23,000–23,050, or even down to 22,900 range
🟩 4. Demand Zones
Zone 1:
22,450–22,600: Strong bullish reaction historically — likely to act as a key demand if a deeper pullback occurs
Zone 2:
22,850–22,950: Validated with prior accumulation & BOS event
🧠 5. Key Observations
Price is at a critical inflection zone:
Testing a resistance zone
At the upper trendline of an ascending channel
A bearish reaction is projected (black arrow)
Possibly targeting the green support zone around 23,180–23,220
If that fails, demand at ~23,000 will likely be tested
Ichimoku Cloud:
Currently price is above the cloud → still bullish
Cloud is thin → potential weakness or upcoming consolidation
⚠️ 6. Trading Bias & Setup Ideas
✅ Bullish Bias (if price holds above ~23,180)
Long entries can be considered on bullish reaction from support
Target: retest of 23,300–23,350 or even breakout continuation
❌ Bearish Bias (if breakdown below support)
Short entry valid below 23,180 with:
TP1: 23,050
TP2: 22,900
A breakdown from the ascending channel would signal trend exhaustion
🔚 Conclusion
Current Price: 23,298.4
Trend: Bullish, but at resistance
Next move: Watch for reaction at resistance and support box below
Bias: Neutral-to-bullish unless the structure breaks below ~23,180

Nasdaq US100 Wave 3 Expansion Toward 31,606 in PlayNasdaq US100 has completed a significant wave cycle with a confirmed wave 1 in the broader Elliott Wave structure. Following this, price underwent a corrective wave 2 that extended from the $22,237 supply zone down to $16,334, marking the conclusion of the previous cycle’s correction. This structure now signals the initiation of a fresh upward impulse, setting the stage for a powerful wave 3 advance.
The emergence of wave 3 will gain full confirmation once price successfully breaks above the external supply zone, reclaiming $22,237. If this breakout occurs with sustained momentum, the wave 3 projection targets an expansion toward $31,606, which aligns with the 161.8% Fibonacci extension from the prior cycle. This forthcoming rally is anticipated to unfold in a five-subwave format, indicative of a high-momentum bullish leg.
As long as price action remains above the key support at $16,334, the bullish cycle remains valid. All eyes should now be on the breakout structure and volume profile around $22,237, as it represents the gateway to a much broader impulsive move.

Weekly UpdateBased on how the previous weeks have been running, closing bearish is my anticipation looking into the new Month. Today i will sit out and observe.
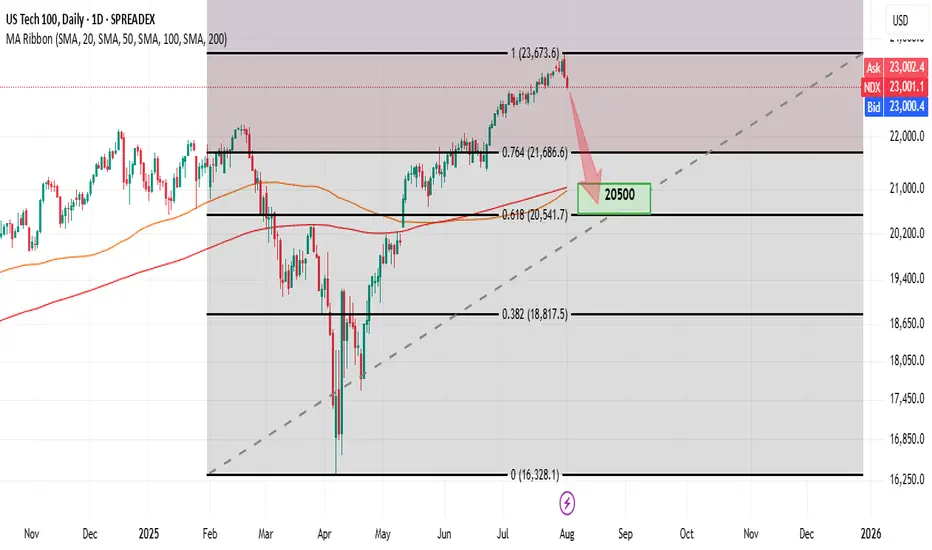
NDX – Double Top & Divergence (H4, D FRL Setup)Hello friends! It's time for our beloved Nasdaq index to cool down. I expect a correction amid the strengthening of the dollar.
H4: clear Double Top forming near 23,000.
Daily: bearish MACD divergence confirms momentum shift.
📐 FRL (H4): neckline at 23,000, perfectly aligned with 100 SMA on H4.
🎯 Target: 0.618 Fib retracement at 20,500 – confluence with 100 & 200 SMA on Daily and strong horizontal support.
NAS100 - EXPECTING THE DUMPTeam, we got short well today with AUS200 - both target hit
we have set up the NAS entry , this is the entry price 23268 - 23200
STOP LOSS at 23100
Once it break above 23320 - bring stop loss to BE
Target 1 at 23320-60 - take 50%-70& partial
Target 2 at 23380-23400
LETS GO
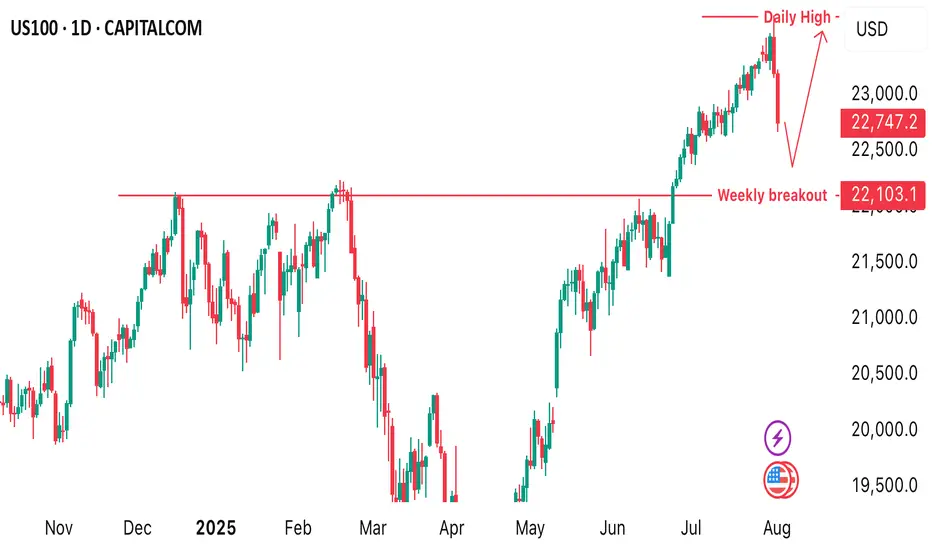
US100The US100, also known as the Nasdaq 100 Index, tracks the performance of the 100 largest non-financial companies listed on the Nasdaq Stock Exchange, primarily in the technology, consumer services, and healthcare sectors. It is a market-capitalization-weighted index and includes major corporations such as Apple, Microsoft, Amazon, NVIDIA, Meta, and Alphabet. As a tech-heavy index, the US100 is highly sensitive to changes in interest rates, innovation cycles, investor sentiment, and macroeconomic indicators, especially those related to inflation, employment, and monetary policy.
Over the past two decades, the Nasdaq 100 has experienced strong long-term growth, driven by the expansion of the digital economy, cloud computing, artificial intelligence, and e-commerce. After a steep correction in 2022 caused by inflation concerns and aggressive rate hikes by the Federal Reserve, the index rebounded in 2023 and 2024, supported by improving macroeconomic conditions, a stabilization in interest rates, and renewed investor confidence in tech and growth stocks. AI-driven investments, semiconductor breakthroughs, and tech-led productivity gains have further fueled its momentum.
As of August 2025, the US100 is trading at 22,747, marking a new historical high. This reflects strong earnings performance from major tech companies, continued innovation in AI and automation, and a more dovish outlook from the Federal Reserve, which has helped reduce pressure on growth equities. Despite its gains, the index remains vulnerable to volatility stemming from inflation surprises, geopolitical risks, and shifts in central bank policy. The Nasdaq 100 continues to be a key benchmark for growth-oriented investors and a barometer for the health of the global tech sector.

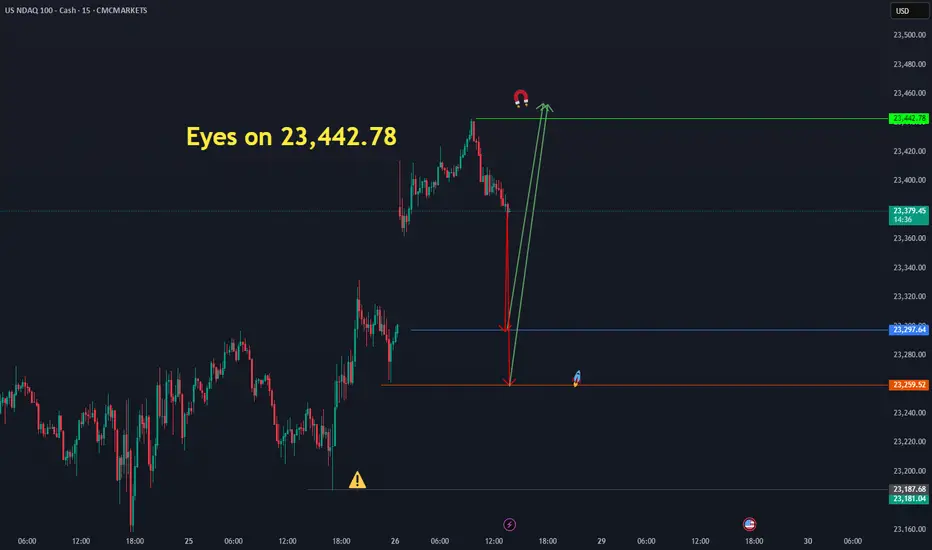
Eyes on 23,442.78 ( us 100 )The Nasdaq has the potential to move upward from the identified price levels of 23,297.64 and 23,259.52, targeting 23,442.78." CMCMARKETS:NDAQ100
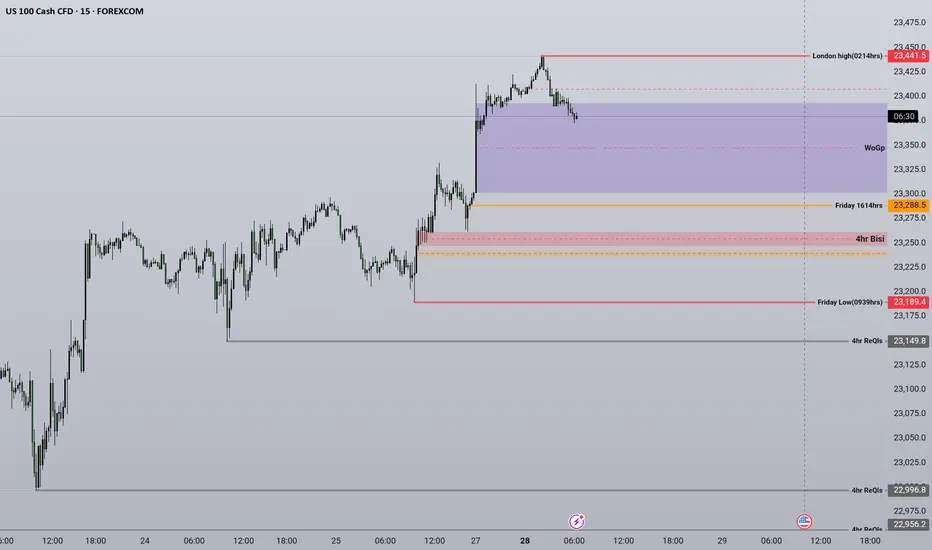
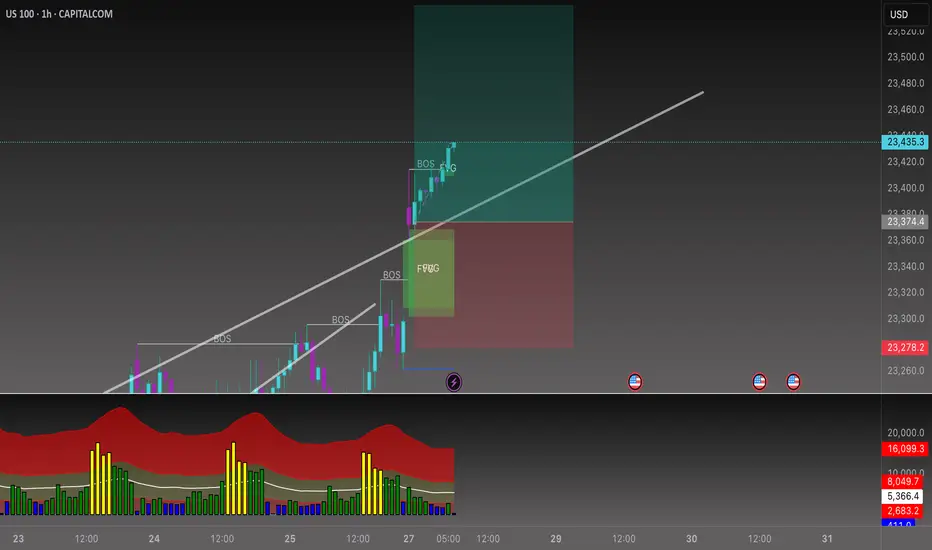
Beyond the Chart – NAS100 Through Technicals & Fundamentals📊 CAPITALCOM:US100 Analysis
Today, NAS100 opened with a huge gap up following former President Trump’s announcement that the U.S. has officially reached a trade agreement with the European Union.
🕳️ After price rejected the gap zone, and volume gets low low. I’m now looking for a potential test of the 23,540 level.
💼 With Q2 earnings season kicking off, stock-moving news will be hitting fast. While retail traders might scramble to catch up, smart money is already positioning for surprise earnings beats.
Stay sharp, this week could set the tone for the next major move.
Fibonacci Retrace Strategy NAS100 Trade Idea📈 NASDAQ 100 (NAS100) is holding a strong bullish trend 🚀. After a weekend gap-up 🕳️➡️📈, price retraced back into the gap zone—exactly what you'd expect in a healthy trending market.
🔍 I'm applying my Fibonacci Expansion + Retrace Strategy 🔢, watching closely for a pullback into equilibrium ⚖️ within the previous price swing. That’s where I’ll be waiting for a bullish market structure break 🔓📊 to confirm my long bias.
🧠 Patience is key here—let the setup come to you.
📌 As always, this is not financial advice!

COULD THE NAS100 BREAKOUT THIS IMPORTANT FIB LEVEL?As examined similar to the SPX500, NAS100 has already reached the fib extension target of 0.618 and facing a resistance. There are indicator divergences on the weekly down to the 4H time frames suggestion a potential correction in likely soon. My thesis for this week is that NAS100 could briefly push through the resistance and clear liquidity above the fib resistance with a capitulation candle before a correction. Therefore the trade idea is caution to the upside as there are no major reversal candle yet on higher time frame but indicators are blowing warning horns so apply tight stop loss on the trade plan this week while watching for a reversal confirmation on the 4H or daily charts.

Nasdaq Index Analysis (US100 / NASDAQ):The Nasdaq index rose following yesterday’s Fed decision and is currently trading near 23,700 USD.
1️⃣ The most likely scenario is a pullback to retest the 23,570 USD zone, or even 23,500 USD, before resuming its upward movement toward a new high.
2️⃣ However, if the price breaks below 23,500 USD and holds, it could trigger a decline toward 23,350 USD, followed by 23,200 USD.
⚠️ Disclaimer:
This analysis is not financial advice. It is recommended to monitor the markets and carefully analyze the data before making any investment decisions.

NextGenTraders81 NAS short swingI have my sell limit set at 23,500 as there is alot of sell limits set there, also at 23,550 hence the SL is above that zone.
I am pretty sure the position will be set on BE before it tries to return to these highs, how long it will take to hit TP, who knows.. a correction within the channel is due after numerous ATHs.
If you will follow, take partials on the way !
Good luck :)

NASDAQ | BEARISHNASDAQ has retraced after hitting its top.A parabolic downward shift and an obvious bearish trend tend to print a LH.It may form an ABCD pattern and a sell stop order may be placed at the breakout of LL.

NASDAQ & NFP- I expect BullishnessHello fellow traders,
Today is NFP and I expect a bulishness as per my PD Arrays analysis. Lets se if it words out.
I have higlighted all important PD Arrays in my chart, keep an eye.
US100 Index – Potential Bearish Reversal in Key Resistance Zone🧠 US100 Index – Potential Bearish Reversal in Key Resistance Zone
Timeframe: 30-Minute | Chart Published: July 24, 2025
---
🔍 Overview
The US100 (NASDAQ) has been trading in a well-structured ascending channel, forming higher highs and higher lows. However, recent price action suggests that the index is testing a critical supply zone near 23,400, with signs of weakening bullish momentum. This may signal a potential corrective phase or bearish reversal.
---
📈 Technical Analysis Breakdown
🔵 Trend Structure:
Price is respecting a clear ascending trendline (blue), connecting multiple higher lows.
Multiple bullish flag/channel formations have been completed within the uptrend, showing healthy momentum until the current point.
🟥 Resistance Zone:
Strong supply zone marked between 23,250 – 23,450.
Price action shows stalling candles and rejection wicks within this zone, indicating buyer exhaustion.
⚠ Bearish Patterns:
The red path projection suggests a head and shoulders-like structure forming at the top of the channel.
This, along with divergence in wave strength and shrinking momentum, supports a potential reversal.
🔵 Key Support:
First support lies around 23,000 — aligning with the ascending trendline and previous consolidation.
If broken, next demand zone is around 22,835 – 22,900, where historical consolidation took place.
---
🔁 Projected Scenario (as per visual path)
1. Price may attempt one last push into the 23,400–23,450 zone (possible false breakout).
2. Rejection from this level could trigger a fall toward the ascending trendline support.
3. A confirmed break of the trendline can lead to a larger correction toward the 22,800 zone.
---
🧠 Unique Insight
This chart combines multi-timeframe structure recognition with a real-time reversal formation inside a long-standing bullish trend. The analysis doesn’t just rely on textbook patterns—it recognizes real-time price behavior shifts, which makes it valuable for proactive traders.
---
📌 Conclusion
While the trend remains bullish overall, caution is warranted as the US100 approaches a historically significant resistance zone. The setup offers a compelling risk-reward short opportunity for aggressive traders, especially if the price confirms a break below trendline support.
---
🔧 Next Steps for Viewers
> “Watch for a clean rejection candle or lower high at resistance before entering short. If trendline breaks cleanly, 22,835 could be the next target zone.”

Nasdaq| Bullish Intent Maintained| Refined OB Reaction In Motion(Refined & Structured):
• Pair: Nasdaq (US100)
• Bias: Bullish / Buy
• 4H Overview: Bullish structure remains intact. Despite the congestion and noise, price maintained its upward trajectory. I refined the drop to mid timeframes for precision and clarity.
• 30M Structure: Refined bullish structure with clear intent. Price has mitigated a clean OB, setting the stage for further continuation.
• Entry Zone: Watching lower timeframes for confirmation to ride the wave higher.
• Targets: 5M to 30M structural highs depending on how price delivers.
• Mindset Note: Noise is just noise until structure filters it out. Precision comes from refining—this setup proves that. Stay focused, stay clean, let intent guide you.