Nasdaq100 currection into ATH OANDA:NAS100USD
i was asked, are we still in an up-trending bull market?
Assuming nothing fundamentally changes with the US tech market, technicals still point to a heavy up-trend, this implies a high likelihood of US100 making an ATH again, but we are likely to see a correction back to 300 dayMA before significant liquidity supports a break of ATHs.
NAS100 trade ideas

Who got in?🟢 NAS100 15min – Bottom Sniped to Perfection!
Another textbook bounce called in real-time by the ELFIEDT – X-REVERSION indicator.
✅ The UP signal printed at the exact low
📈 Price launched shortly after with a near vertical reaction
💥 No hesitation. No lag. No repainting.
⸻
🔍 Still watching from the sidelines?
This is what precision looks like when momentum, volatility and structure all align — and we’ve automated that edge into one system.
📌 Just follow the rules:
• Enter on the signal close
• SL below the signal bar
• Let the market do the rest
⸻
🔥 If you’re still hesitating… you might just be watching these trades instead of catching them.
Time to load up the ELFIEDT – X-REVERSION tool and trade with confidence.

Reversal in Play or Institutional Continuation? | NAS100USDCritical Zone with VEP Trader ⚠️
Nasdaq 100 (NAS100USD) is showing mixed signals — and it’s exactly in these types of setups that our VEP Trader strategy shines. Here's what I'm seeing and how we're breaking it down step by step.
🔍 1. Trend Confirmation (1D)
On the daily timeframe, NAS100USD is showing a weak bullish trend based on the Support & Resistance and the Squeeze Momentum indicators.
📉 However, the most recent daily candle swept liquidity from two key days:
📅 June 6
📅 June 13
This triggers an alert in our VEP strategy: liquidity taken = institutional zone possibly in play.
💧 2. Liquidity Sweep + FVG (Fair Value Gap)
After the sweep, switching to the 1-hour timeframe (1H) reveals a large Fair Value Gap (FVG) just below the cleared liquidity zone.
This offers a potential setup — only if price returns to that FVG, and the structure validates the trade:
Retest the FVG zone
Show signs of reversal structure
Confirm with bullish Squeeze Momentum on lower timeframes
🛠️ 3. Execution with VEP Trader
🎯 If price pulls back into the FVG, we’ll be watching for:
Bullish reaction after liquidity has been swept
Clear bullish divergence in momentum
Previous support and EMA alignment in 5M/2M charts
🟢 If all conditions align → possible CALL entry based on VEP structure.
⛔ Stop Loss & 🎯 Take Profits (VEP Guidelines)
Suggested SL: below the FVG or last clean low
TP1: immediate reaction zone or recent high
TP2: next liquidity zone above. Up to four TP
Or target the last pullback for a more secure exit
✅ Final Thoughts
This is a classic scenario where we don’t guess — we wait for institutional confirmation.
The VEP Trader Strategy guides us with Vision, Execution, and Precision.
👉 What do you think?
Is NAS100USD gearing up for a new leg up — or was that just a liquidity flush before a deeper move?
Drop your take in the comments 👇
#NAS100USD
#VEPTrader
#FairValueGap
#LiquiditySweep
#SmartMoneyConcepts
#PriceAction
#TechnicalAnalysis
#InstitutionalTrading
#MarketStructure
#CleanSetup
#DivergenceSetup
#MomentumAnalysis
#GapTrading
#TradeWhatYouSee
#ScalpingForex
#AlgoPro
#ForexNAS100
#LiquidityZones
#SqueezeMomentum
#IntradaySetup
#BreakdownStrategy
#SupportResistance
#ReversalWatch
#PrecisionTrading
#TradingPlanReady

NAS100 WILL FALLLooking at this H4 charts, as we can see it, FUSIONMARKETS:NAS100 lost the backup of our H4 50EMA, im expecting a clean bounce at the retest of these 50EMA. Targeting the below 200EMA for TP.

June 19th - 1st combine tradeGreat trade
Need more confidence to trust my analysis and hold the trade to full TP
Fill Gap model trade

Hanzo / Nas100 30 Min ( Accurate Tactical Break Out Zones )🔥 Nas100 – 30 Min Scalping Analysis (Bearish Setup)
⚡️ Objective: Precision Breakout Execution
Time Frame: 30-Minute Warfare
Entry Mode: Only after verified breakout — no emotion, no gamble.
👌Bullish After Break : 21710
Price must break liquidity with high volume to confirm the move.
👌Bullish After Break : 21550
Price must break liquidity with high volume to confirm the move.
☄️ Hanzo Protocol: Dual-Direction Entry Intel
➕ Zone Activated: Strategic liquidity layer detected — mapped through refined supply/demand mechanics. Volatility now rising. This isn’t noise — this is bait for the untrained. We're not them.
🩸 Momentum Signature Detected:
Displacement candle confirms directional intent — AI pattern scan active.
— If upward: Bullish momentum burst.
— If downward: Aggressive bearish rejection.
Hanzo / Nas100 30 Min ( Accurate Tactical Break Out Zones )

Nasdaq-100 Wave Analysis – 19 June 2025- Nasdaq-100 reversed from long-term resistance level 22000.00
- Likely to fall to support level 21000.00
Nasdaq-100 index recently reversed down from the major long-term resistance level 22000.00 (which has been steadily reversing the price from the end of last year).
The downward reversal from the resistance level 22000.00 will form the weekly Shooting Star candlesticks reversal pattern if the price closes this week near the current levels.
Given the strength of the resistance level 22000.00 and the overbought weekly Stochastic, Nasdaq-100 index can be expected to fall to the next support level at 21000.00.

SELL-THE -RALLY :Swing trade limit Trend & Structure Broken
The green up-trend line and the last swing low were breached (you saw a BOS and CHoCH). That’s your first clue that buyers have lost control.
Failed Rally into Supply
When price pulled back up, it stalled under the old swing high / “equilibrium” zone. It never made a fresh higher high—so there’s no reason to chase longs.
Entry (Blue @ ~21,689) 🔵🚀
After price broke the rising trendline and the last swing low, it rolled back up into the equilibrium/supply area. That gives you a “sell-the-rally” entry at the blue level—where late buyers and remaining shorts congregate.
Stop-Loss (Red @ ~22,071) 🔴❌
Placed just above the prior swing high and the upper edge of the supply zone. If price pops above this red line, it signals the short setup has failed and bulls are back in control.
Take-Profits (Greens @ ~21,448 → 21,066 → 20,718 → 20,306) 🟢🎯
These green levels are the next pockets of demand/value below:
21,448 – the minor PDL/PWL area 📉
21,066 – first major demand zone 💰
20,718 – deeper value area 📦
20,306 – unfilled gap that often attracts fast buyers ⚡
Happy trading! 👍

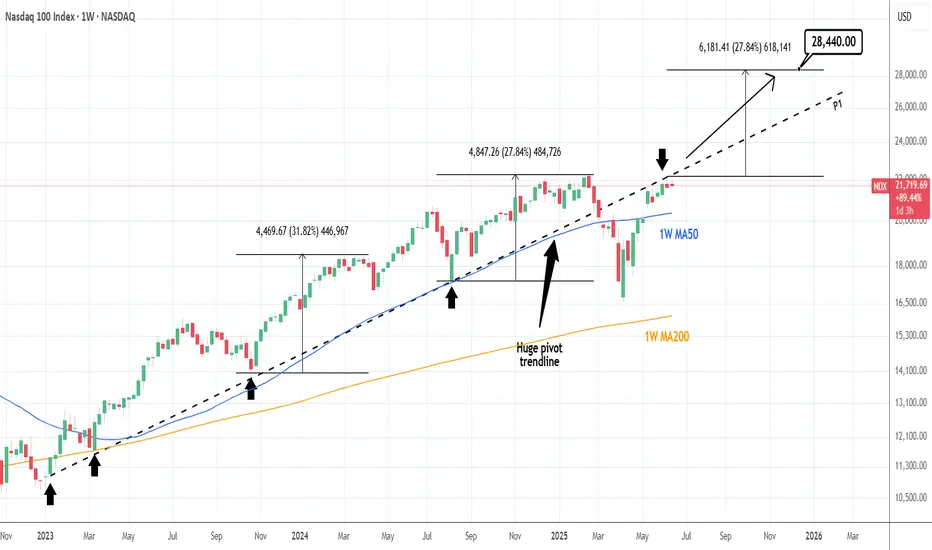
NASDAQ: Huge pivot can catapult it if broken.Nasdaq has turned neutral again on its 1D technical outlook (RSI = 54.712, MACD = 377..560, ADX = 20.644) as it has been struggling to cross above a hidden trendline, the Pivot P1 that was at the start of this Bull Cycle a support and after the trade war acts now as a resistance. If broken, we anticipate a +27.84% rise at least (TP = 28,440), which may very well be an end of year target.
## If you like our free content follow our profile to get more daily ideas. ##
## Comments and likes are greatly appreciated. ##

US100 / NASDAQ TodayUS100 / NASDAQ Today is still bearish
My SSM Reversal Pattern is comming.
This is just my view of course

NASDAQ - UniverseMetta - Signal#NASDAQ - UniverseMetta - Signal
D1 - Formation of a narrowing diagonal + price broke through the lower trend line through a 3-wave structure. It is better not to increase risks. Stop behind the maximum of the 1st wave.
Entry: 21509.0
TP: 20986.3 - 20372.2 - 19784.5 - 18396.7
Stop: 22160.6

My View on NAS1001. Price has been trending up for a long time.
2. A possible Reversal Pattern spotted
3. Head and Shoulder Pattern
4. Almost all elements of the Pattern have appeared
5. Refer to the Chart for entry details
6. Apply proper risk management based on your account size.
"Direction is Better than Speed"
Aliyu Gital

NASDAQ 2 Expected Scenarios Very Clear , Which One You Prefer ?Here is my opinion on Nasdaq on 4H T.F , The price still below my res so we can sell it if the price touch the res level again , and if we have a daily closure above my res then we can buy it with retest for the broken res , so it`s very easy if we still below the res we can sell and if we going up it we can buy it . but we need a daily closure above first .

NASDAQ - Long now!⚡️ NAS100 15-Min Reversal Signal – Caught the Bottom?
The ELFIEDT – X-REVERSION indicator just printed a clean BUY signal on NAS100 after a strong sell-off into new session lows.
📉 Price had already extended far from structure
📈 RSI momentum began shifting and reversed sharply
✅ Volume spike and RSI reversal confluence added weight to the signal
📍 These types of signals are designed to catch mean reversion moves — especially powerful when price accelerates into extremes and the candle closes with absorption.
🎯 Remember: the signal is plotted on the close of the bar, meaning it doesn’t repaint and allows for real-time decision-making with a clear stop-loss just below the low.
💡 Watch for a potential retrace toward structure or session VWAP.


NASDAQ Analysis Stalking shorts on the Daily - nearby.
My weekly sentiment is bearish cause of technical factors.
Among the catalysts is bullish performance on the US Dollar index and price action compared to the US30 & US500.
Look to sell near 4H swing high, entry using the 15M bearish ChoCh only after three legs of bullish correction on the 1H frame into the highlighted levels of the swing high.
Anticipation is for the third leg to react bearish and the fourth leg to deliver impulse to the sell side.


NASDAQ 100 Under Pressure –Watching 21470 Break for ContinuationUSNAS100 – Technical Overview
USNAS100 has reached the support level we highlighted yesterday and continues to trade within a bearish trend, especially after confirming a 1H close below 21635.
Bearish Outlook:
As long as the price remains below 21635, the next target is 21470.
A break below 21470 would confirm further downside toward the support zone at 21375 and 21250.
Bullish Scenario:
Bullish momentum may return if the price breaks above 21635 on the 1H timeframe, targeting 21780 and potentially 21930 and 22090.
• Support: 21470 / 21375 / 21250
• Resistance: 21780 / 21930 / 22090


Nas100 target reached.I uploaded a trade idea of this yesterday and these are the results, I used proper risk management and proper execution approach!

Nasdaq 100 Trade idea for the day and bias.This is what I'm expecting Nas100 to do today looking at the higher timeframe structure.

US100 2H in a Symmetrical Triangle—Eyes on BREAKOUT!1. A Symmetrical Triangle in Play
Rising support line (green) connecting the sequence of higher lows.
Falling resistance line (red) connecting the lower highs.
Price is squeezing into the apex of that triangle – classic consolidation/indecision.
What to watch:
A clean break above the red trendline (~21,820–21,850) would be a bullish signal.
A break below the green trendline (~21,650–21,670) would open the door for a move down toward 21,500 or even the 21,400 zone.
2. Value & “Premium” Zones
The green shaded area around 21,500–21,600 is marked “Equilibrium/Value,” where buyers have stepped in repeatedly.
Above ~21,950 there’s a “Premium” supply zone (red) where heavy selling has shown up.
These zones can act as sensible targets or rejection areas once price breaks out of the triangle.
3. Key Reference Levels
PDH / PDL (Previous Day High / Low): ~21,860 / ~21,620
PWH / PWL (Previous Week High / Low): ~21,960 / ~21,430
Traders often use these to confirm break-outs (e.g. holding above PDH now that it’s pierced).
4. Momentum Indicators
MACD: Lines hovering just under zero, histogram weakening → suggests the bulls aren’t quite firing on all cylinders yet.
RSI: Sitting around mid-40s, neutral but with a slight downside bias.
Neither is over-extended; momentum is “sleepy,” which aligns with the triangle/consolidation picture.
5. What This Means for Traders
Neutral bias until one side wins the breakout.
Bull scenario: Triangle → breakout → retest of ~21,820 → rocket toward 22,000–22,200 supply zone.
Bear scenario: Failure at the red trendline → drop through support → test 21,600 then 21,400 demand areas.
