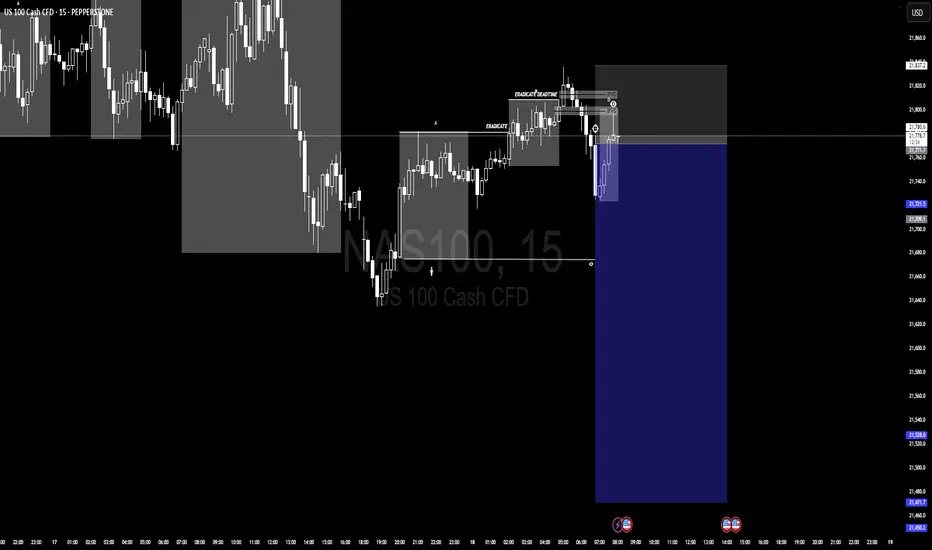
NQ! SHORT SCALPE1.Entry method 15 minutes IFVG.
2.Entry 21768.41
3.Stoploss:21831.77
4.Takeprofit:21471.40
This not not financial advice as im using this platform to journal trading forex and CFD involves risk so apply your own strategy PEPPERSTONE:NAS100
NAS100 trade ideas
Hanzo / Nas100 30 Min ( Accurate Tactical Break Out Zones )🔥 Nas100 – 30 Min Scalping Analysis (Bearish Setup)
⚡️ Objective: Precision Breakout Execution
Time Frame: 30-Minute Warfare
Entry Mode: Only after verified breakout — no emotion, no gamble.
👌Bullish After Break : 21840
Price must break liquidity with high volume to confirm the move.
👌Bullish After Break : 21930
Price must break liquidity with high volume to confirm the move.
👌Bearish After Break : 21755
Price must break liquidity with high volume to confirm the move.
☄️ Hanzo Protocol: Dual-Direction Entry Intel
➕ Zone Activated: Strategic liquidity layer detected — mapped through refined supply/demand mechanics. Volatility now rising. This isn’t noise — this is bait for the untrained. We're not them.
🩸 Momentum Signature Detected:
Displacement candle confirms directional intent — AI pattern scan active.
— If upward: Bullish momentum burst.
— If downward: Aggressive bearish rejection.

FOMC short: waiting for this short entry to get activated.1. Entry ~21,884.4
Why here? Price has rallied into that red “supply” zone (fair-value gap + bearish order block), then chopped down and back up to retest its lower edge. That level also coincides with the broken swing pivot (Change-of-Character from bull→bear). We short the retest, expecting supply to push price lower.
2. Stop-loss 21,912.0
Why there? Just above the top of the supply zone/weak high. If price climbs above 21,912, it’s cleared the zone and negated the bearish bias—so we get out.
3. Take-Profits
TP1 at 21,800.9 (the old swing-high turned support, labeled “PMH”)
First support zone—locks in quick gains and covers your risk.
TP2 at 21,675.0 (the previous day’s low, labeled “PDL”)
A deeper support area where sellers will likely pause or flip to buyers.
(Optional TP3 at 21,575.8 if you want a final scalp into the gray “equilibrium”/demand zone.)

Long entry set up Now that’s the 1 hour FVG wasn’t broken, but BoS has been established, looking at the OB on the 15 min TF as the next long entry. Entry at 21,765 with SL at 21,690 and TP1 of 21,890.

NAS - ACTIVE PROFITABLE SET UP TRADETeam, tonight the US rate will announce.
I will wait for my set up to entry, if NOT I will not trade tonight
Please carefully review the chart
REMEMBER if it not hit your setup , DO NOT TRADE. simple as that
today we already hit our target for NAS, DAX AND DOW.

Hanzo / Nas100 30 Min ( Accurate Tactical Break Out Zones )🔥 Nas100 – 30 Min Scalping Analysis (Bearish Setup)
⚡️ Objective: Precision Breakout Execution
Time Frame: 30-Minute Warfare
Entry Mode: Only after verified breakout — no emotion, no gamble.
👌Bullish After Break : 21840
Price must break liquidity with high volume to confirm the move.
👌Bullish After Break : 21930
Price must break liquidity with high volume to confirm the move.
👌Bearish After Break : 21755
Price must break liquidity with high volume to confirm the move.
☄️ Hanzo Protocol: Dual-Direction Entry Intel
➕ Zone Activated: Strategic liquidity layer detected — mapped through refined supply/demand mechanics. Volatility now rising. This isn’t noise — this is bait for the untrained. We're not them.
🩸 Momentum Signature Detected:
Displacement candle confirms directional intent — AI pattern scan active.
— If upward: Bullish momentum burst.
— If downward: Aggressive bearish rejection.
🦸♂️ Tactical Note:
The kill shot only comes after the trap is exposed and volume betrays their position.
Hanzo / Nas100 30 Min ( Accurate Tactical Break Out Zones )

NSDQ100 Geopolitics, Fed & Rates Outlook Geopolitics & Market Sentiment
Iran-Israel conflict enters its sixth day, raising fears of broader escalation.
Speculation is building that Donald Trump may authorize the use of the Massive Ordnance Penetrator (bunker-buster bomb) to target Iran’s nuclear facilities.
Trump is also meeting with Pakistan’s army chief today for talks on Iran, adding to geopolitical uncertainty.
So far, Iran’s oil infrastructure remains intact, and Hezbollah has stayed out of the conflict, limiting immediate economic fallout.
Fed & Rates Outlook
The Federal Reserve is expected to hold rates steady today as it waits for clearer economic signals amid ongoing Trump policy shifts.
Trump is pressuring the Fed, now arguing for lower rates to cut US debt costs.
Traders are building record positions betting on a dovish Fed shift after Powell's term ends in May 2026.
Market Implications for NSDQ100
Nasdaq futures are mildly positive, supported by:
Stability in tech earnings outlook
Expectations of Fed staying on hold, with a possible dovish bias emerging
However, Middle East tensions remain a risk. Any strike on oil infrastructure or major military escalation could:
Trigger a risk-off move
Push oil prices higher, raising inflation concerns
Weigh on tech stocks sensitive to rate outlooks and sentiment
Key Focus for Nasdaq Traders Today:
Fed decision and Powell’s tone (especially on inflation and growth risks)
Headlines from the Middle East
Oil price action near the five-month high (WTI around $73.50–$74)
Resistance Level 1: 22070
Resistance Level 2: 22370
Resistance Level 3: 22780
Support Level 1: 21300
Support Level 2: 21060
Support Level 3: 20820
This communication is for informational purposes only and should not be viewed as any form of recommendation as to a particular course of action or as investment advice. It is not intended as an offer or solicitation for the purchase or sale of any financial instrument or as an official confirmation of any transaction. Opinions, estimates and assumptions expressed herein are made as of the date of this communication and are subject to change without notice. This communication has been prepared based upon information, including market prices, data and other information, believed to be reliable; however, Trade Nation does not warrant its completeness or accuracy. All market prices and market data contained in or attached to this communication are indicative and subject to change without notice.

USNAS100 - Mideast Conflict & Fed Uncertainty Pressure FuturesWall Street Futures Edge Lower Amid Prolonged Mideast Conflict
U.S. stock index futures slipped slightly on Tuesday as the ongoing Middle East conflict entered its fifth day, weighing on global sentiment ahead of the Federal Reserve’s upcoming policy meeting.
Technical Outlook:
Price action remains in a sensitive zone, but the bias stays bearish below 21930.
🔻 A confirmed 1H close below 21790 would likely trigger a deeper move toward 21635, and potentially 21470.
🔺 On the upside, a break above 21930 would indicate renewed bullish momentum, opening the path toward 22065 and 22200.
📌 If price holds above 21790, a test of 21930 is likely.
Any positive geopolitical developments or ceasefire negotiations could spark a stronger upside move.
Key Levels:
• Pivot: 21790
• Resistance: 21930 / 22065 / 22200
• Support: 21635 / 21470 / 21375

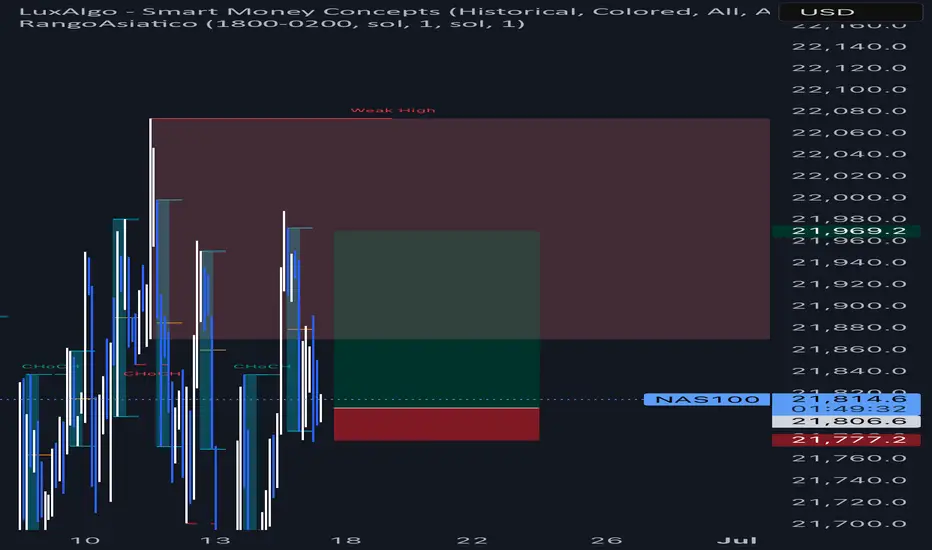
NAS100 (US100) Mid Week Reversal - Bullish Order FlowA Half Batman presents itself during the Asian session and seems to be ready for LDN opening. This Peak Formation could be seen as the reset, to turn NAS100 bullish and ready to break the structure high.


NASDAQ Consolidation: Why Sitting Out Is Sometimes the Best PlayI'm currently monitoring the NASDAQ (US100) closely, and on the 4-hour chart, we can clearly see that the market is in a phase of consolidation 🔍
Yesterday, I was anticipating a bullish breakout, which could have signaled the start of a structure with higher highs and higher lows — something that would have presented a clean long opportunity 📈. However, during the U.S. session, the NAS100 momentum shifted and we instead saw a bearish breakdown, invalidating the previous setup 🚫
As things stand now, there's no clear directional bias on the 4H — just a sideways range with neither bulls nor bears in full control 🤝. This type of environment calls for patience and discipline.
It's worth noting that knowing when not to trade is just as important as knowing when to pull the trigger. Sitting on the sidelines and allowing the market to make the next move — whether that’s a break above or below this consolidation range — is a valid and often wise decision 🧘♂️📊
At the moment, my preference is to remain neutral and let price show its hand before committing to a position.
⚠️ Disclaimer:
This analysis is for educational purposes only and does not constitute financial advice. Always do your own research and apply proper risk management when trading.

Missiles in the Middle East, Headwinds on Nasdaq: NAS100 onHey There;
The trend line on the NAS100 has been broken to the downside. My target level after this breakout is 21,299.47. If the price moves towards this level, I think it will reach my target in line with fundamental analysis due to the broken trend line and Iran-Israel war tensions.
I meticulously prepare these analyses for you, and I sincerely appreciate your support through likes. Every like from you is my biggest motivation to continue sharing my analyses.
I’m truly grateful for each of you—love to all my followers💙💙💙


NAS100 is about experience a big fallfrom the chart, you can find out that nas100 is about to be bearish...
Reason;
1, Double top pattern
2, Ascending triangle
Turn Your Chart – Turn Your ViewCurious about tricking your trading mind?
A lot of traders are constantly searching for new indicators or secret setups. But what if your biggest breakthrough is just a perspective shift away—literally?
This article is about a unique but effective experiment: Rotate your candlestick chart by 90 degrees (horizontal instead of vertical) and see how your perception and analysis change.
Example: ibb.co
No, this isn’t a volume profile – this is the real NAS100 chart, just rotated by 90°!
What do you see now? New patterns? Different price action? Sometimes a fresh angle reveals details you normally overlook and helps break your trading habits.
---
What changes?
1. Patterns suddenly look different
Trends, consolidations, and breakouts appear in a new light:
– Uptrends and downtrends lose their emotional “up feels hard, down feels easy” effect.
– Sideways markets become vertical clusters—your eye spots new structures.
2. Support & resistance become less dominant
Your classic support and resistance zones disappear.
You’re forced to rethink important levels—maybe you’ll notice supply/demand zones you always missed.
3. Emotional neutrality
With a rotated chart, the usually existing “Long is better” bias fades.
You view price action more objectively—and may discover signals you’d otherwise miss.
---
Try it out!
What did you discover by rotating your chart? Comment below or share your thoughts!

Hanzo / Nas100 30 Min ( Accurate Tactical Break Out Zones )🔥 Nas100 – 30 Min Scalping Analysis (Bearish Setup)
⚡️ Objective: Precision Breakout Execution
Time Frame: 30-Minute Warfare
Entry Mode: Only after verified breakout — no emotion, no gamble.
👌Bullish After Break : 21930
Price must break liquidity with high volume to confirm the move.
👌Bearish After Break : 21770
Price must break liquidity with high volume to confirm the move.
☄️ Hanzo Protocol: Dual-Direction Entry Intel
➕ Zone Activated: Strategic liquidity layer detected — mapped through refined supply/demand mechanics. Volatility now rising. This isn’t noise — this is bait for the untrained. We're not them.
🩸 Momentum Signature Detected:
Displacement candle confirms directional intent — AI pattern scan active.
— If upward: Bullish momentum burst.
— If downward: Aggressive bearish rejection.
🦸♂️ Tactical Note:
The kill shot only comes after the trap is exposed and volume betrays their position.

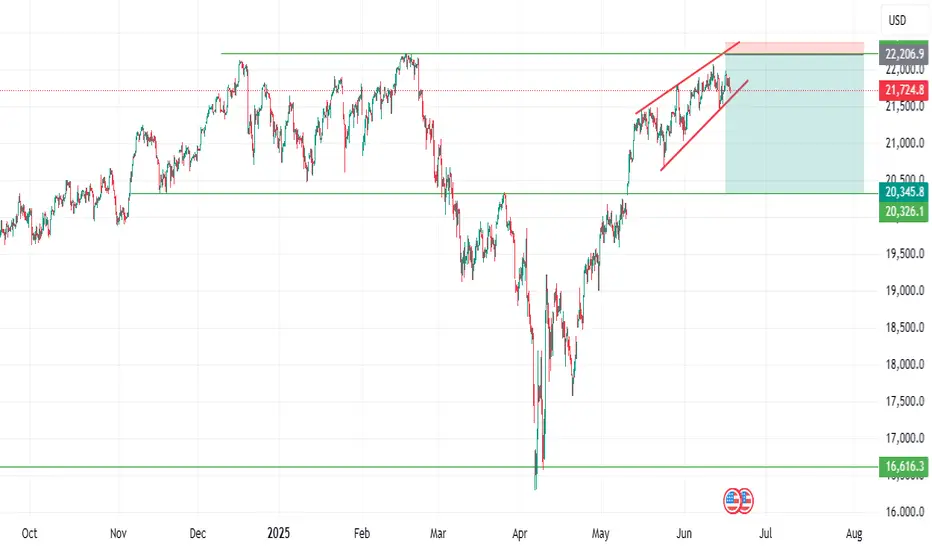
2 Scenarios1) You close above that weekly to make a 1,2 for the weekly elliot.
2) You close below that March 31st weekly, making the corrective wave not just 3), but a),b),c).
But no matter what, at the end of the day I am still eyeing for a close above the historic high during 2021 November/December zone.
Great set up from crazy low DXY, very overvalued Eurozone equities, and also a corrective wave for the global index including the US equities.

Wait for the NAS100 to break the parallel lines before shortingPEPPERSTONE:NAS100 - Need the price on the 1H TF to break down the parallel lines before taking any short position. After than we could see the index going to 21,450. But till then hold your shorts.

Nasdaq EMA and FVG AnalysisThe EMA 50 on the hourly chart at 21,810 has been an area of support. Breaking down blow this level will send the price searching for EMA 200 at 21,740. Above 21,900 there is an FVG from earlier today and breaking through the upper bound at 21,940 will likely send the price upwards beyond yesterday's swing high.

US100 Cautious ApproachThe US 100 is looking for direction to move. On the 1H TF previously it have broken downward trend and formed a HH and HL indicating bullishness. but after the first leg it have gone into consolidation.
Cautios appoach is required with patience as per on going geol political condition and uncertanity looming over.

QQQ - NASDAQ Has Never Been This ExpensiveQQQ relative to the money supply reveals that markets have never been this expensive in history. Despite the significant amount of money pumped in during the COVID-19 pandemic, the economy has not kept pace with all the zeros added to Gov debt.
If we can't lower deficits now at max employment, when will we?
Tulips!
Caution is in order despite what "experts" may tell you.
Click like Follow Subscribe, let's get to 5,000 followers.

NAS LONGNS longs to take out all the liquidity above. Last week's highs to be take out and also structural pattern.
Nasdaq has topped?Both charts and political situation of the globe is not good for risky assets.. Nasdaq bubble is about to pop..
