BTC Diminishing Cycle ReturnsIf we can break and hold a monthly above the blue fib spiral, then this model is broken and can be ignored.
See the image below for the correct scaling.
BLX trade ideas

Post halving rally to $750kThe halving in April 2024 will serve as catalyst to trigger the active hidden bullish divergence in RSI vs. the all-time monthly log chart resulting in a 2-year rally up to $750,000 by end of year 2025

Bitcoin's Most Relevant Price LevelsThis is a cleaner chart with the relevant channel and price levels using weekly closes.
Next we will take a look at Moving Averages using standard and nonstandard time periods.

Bitcoin's Price LevelsSimplicity is significant. When viewing a price chart, what are the first things we notice?
Highs, Lows, and Slopes
As we begin to analyze a chart, note the major and highs. Like a magnet, these are price levels that price will gravitate toward and repel from over time. How price approaches these levels will give us insight into the likelihood of a continuation or reversal at the price level. A price level is resistance when above the price and support when below the price. The space between price levels is the range. The more times price interacts with the price levels that make up the range while remaining rangebound, the higher the likelihood that the eventual breakout from the range will result in price never returning to the former range. A relatively long amount of time spent rangebound is a sign that price has stabilized and is ready to continue or reverse the preceding move that brought it into the range. Oftentimes we notice resistance turned support or support turned resistance as price breaks through a price level. This would imply that one price level is losing its significance relative to the next price level, which may not yet be identified. In order to identify a price level that does not yet exist, we must turn to alternate charting methods.
Channeling is one way to incorporate price levels with the slope, i.e., a channel is a sloped range or an average rate of change with the expected deviation around the midpoint. Occasionally the price levels that make up a range are seemingly ignored in the case of a breakout. The next area of resistance or support can be identified by drawing a channel. A downward channel is formed by drawing a trendline that connects two major highs with a parallel line that passes through the major low separating major highs. An upward channel is formed by drawing a trendline that connects two major lows with a parallel line that passes through the major high separating major lows.
At every moment multiple ranges and channels exist simultaneously. Special attention is paid to price as it approaches the support or resistance of a channel, as we search for the formation of new price levels and ranges. There is also significance when trendlines and price levels intersect since the market must decide which force is stronger. At times price is not near an intersection but the timing of the intersection may prove important to changes in trend. When the price remains rangebound, the market is taking its time to organize its next move. Breaking through the support or resistance of a channel should alert us to consider a different or altered channel along with other metrics, such as moving averages.

The Golden RatioAlso known as phi, the Golden Ratio can be derived by determining the proportion at which dividing the whole equals the proportion between the smaller and larger segment that together make up the whole.
Algebraically, this can be describes as:
x + y = 1
|x| = y / x
x (and y) must be positive since they make up a whole.
Isolate the variable:
y = 1 - x
y = x^2
Combine & Solve:
1 - x = x^2
...
0 = x^2 + x - 1
...
x = 0.618
This ratio is also discoverable by considering the ratio of adjacent numbers in a sequence that continues by adding the two prior numbers, starting with 0 and 1, the Fibonacci Sequence: oeis.org
0, 1, 1, 2, 3, 5, 8, 13, 21, 34, 55, 89, 144, 233, 377, 610, 987, 1597, 2584, 4181, 6765, 10946, 17711, 28657, 46368, 75025, 121393,...
As the sequence continues, the ratio of adjacent numbers approach 0.618.
Why stop there?
Taking the ratio of all numbers in the Sequence produce more ratios that I call Fibonacci Multiples, which approach Lucas Numbers: oeis.org
..., 0.000733, 0.00119, 0.00192, 0.00311, 0.00503, 0.00813, 0.0132, 0.0213, 0.0344, 0.0557, 0.0901, 0.1459, 0.236, 0.382, 0.618, 1 ,1.618, 2.618, 4.236, 6.854, 11.09, 17.94, 29.03, 46.98, 76.01, 122.99, 199, 322, 521, 843, 1364, 2207, 3571, 5778, 9349, 15127, 24476, 39603, 64079, 103682, 167761,...
Given the similar relationship, is interesting but ultimately unsurprising to note how the sum of all ratios below the Golden Ratio of 0.618 approach 1 and the beginning significant digits begin to resemble whole numbers found in the Fibonacci Sequence.
Understanding that growth and decay is relative, we should then expect to see these ratios appear when we look for it...

More Relevance From Bitcoin's 2019 Monthly Channels The right channel contains the price, but it would be a mistake to simply discard the channel once it seemingly become invalidated.
The chart speaks for itself; who's listening?

Does Bitcoin's Monthly Channel from 2019 Remain Relevant?While the usefulness of a channel diminishes over time, I notice bitcoin moving along the same angle as it has in years past. Interestingly, the space between channels may not be coincidental.
How long will bitcoin continue to appreciate at this rate?
At this rate bitcoin will be back to a new all time of $70k in October 2024.
Will bitcoin reach the bottom of the former channel (red line) ever again?
This could coincide with a bitcoin top around $400k at the end of 2025.
Be prepared but remain flexible.


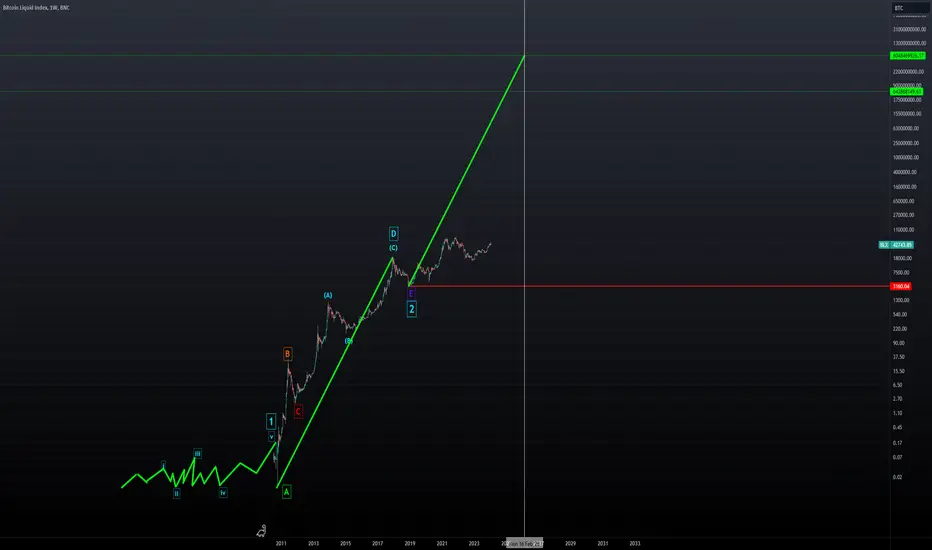
TRILLION DOLLAR BITCOIN CHART - Watch The Video...In the video linked below featuring this chart, I discussed the potential range of 6 trillion within a 65 trillion context. The distinction in measurement depends on whether you assess it in terms of percentage or a linear scale. The underlying rationale is rooted in the concept that if Wave 2 can undergo a 200 million percent expansion during an expanded correction, then Wave 3 would be at least as extensive.
Regardless of whether this expansion is attributed to inflation, one thing certainty prevails: people desire liberation from the current system of control and perceived enslavement. Could cryptocurrencies emerge as the new sovereign currency, leading to a substantial wealth transfer solely based on the power of choice? This proposition seems plausible, considering that the existing system would collapse without our continued faith in it. Consequently, the new system could establish itself as an independent entity, regardless of the prevalence of fake fiat dollar bills within the current framework. This implies that we held the power all along and are now unleashing a new tool against authoritarianism.
This perspective directly contradicts the concept of Central Bank Digital Currencies (CBDCs), as they would signify more of the same, if not worse.
The key insight into this chart lies not only in its deviation from Elliott Wave analysis but also in the fact that AriasWave deliberately evolved to focus solely on the corrective phase of a move. The 200 million percent purely as a correction indicates that the impulsive phase yet to come suggests that the best is indeed on the horizon.
TRILLION DOLLAR BITCOIN - No, It's Not Clickbait...To begin with, it's crucial to emphasize that this approach differs significantly from Elliott Wave analysis. Utilizing the AriasWave methodology involves years of observation and ongoing pattern analysis, making it distinct from conventional techniques. This video may seem out of the ordinary for this channel, as I've consistently held a contrarian view on Bitcoin since its inception.
By conducting a comprehensive analysis across various cryptocurrencies and concentrating on those that exhibit unique characteristics, I've formulated certain assumptions that have the potential to challenge conventional thinking using straightforward logic. This reasoning is rooted in distinguishing between impulsive moves and corrections. When a correction expands by a remarkable 200 million percent, it signifies an unusual occurrence with implications that extend into various aspects of daily life.
I don't believe we are immune to hyperinflation solely due to the existence of central banks. Instead, I perceive central banks as akin to an inebriated driver behind the wheel, with monetary policy as their preferred intoxicant. To illustrate, using the analogy of a central banker, it appears that when your only tool is a hammer, everything tends to resemble a nail. In response to every crisis, the singular tool employed is more Quantitative Easing (QE). While this type of inflation has been a persistent issue, much like the boiling frog analogy, the market seems to be reaching a critical point.
I encourage you to assess the content for yourself, bearing in mind that every posted comment endures indefinitely. Your efforts on this channel will yield lasting results, so, as always, conduct thorough research and refrain from seeking confirmation of preexisting biases if that's your inclination.

BitcoinBuy the dip opportunity very close around the FWB:31K +/-4k. Be ready it may be quicker than you expect.

Bitcoin: Redux ITargets listed for cycle tops.
30-40k expected bottom before continuation to 200k levels.
Halving April 2024.


Invest in Bitcoin: Analyzing Market with Fibonacci PitchforkAre you considering investing in Bitcoin but unsure of the best time to do so?
The past few years have seen a bear market for cryptocurrency, but it's important to remember that markets are cyclical and that prices will likely rise again.
One of the best tools to analyze market trends and predict future price movements is the Fibonacci Pitchfork.
This tool uses trendlines to identify support and resistance levels and can also be used to project future price movements.
According to the Fibonacci Pitchfork, we are currently in the bottom territory of the trend for Bitcoin, which suggests that now may be the perfect time to invest.
There is potential for significant price appreciation in the coming months.
If you're willing to hold for the long term, this could be an excellent opportunity to get in at a low price.
Don't miss out on the potential for significant returns on your investment.
Best of luck.


Bitcoin forecastBitcoin is currently poised to form a wonderful reversal candle. Attention, the week is not finished yet - this could initiate the longed-for correction.
The candle bounced exactly at the 61 Fib which has always led to a sell expression in the past.
However, the correction will only be short-lived (Q1) which should be used to stack sats again before the actual bull run.
It looks like we are trapped in this trend channel in blue until we break through it UP.
From this point on we are in the final phase of the bull market

Hash rate capitulationThe hash rate capitulation (HRC) indicator used in the Bitcoin Bottom Indictor (BBI) has fired. The HRC indicator measures the rate of change of the hash rate. Steadily increasing hash rate is a sign of health of the bitcoin network. This indicator uses moving averages (20- and 100-day) of the hash rate to indicate when a decrease in the rate of change is has occurred (i.e., the 20-day MA goes below the 100-day MA). This indicator triggers when the 20-day moving average of the hash rate going below the 100-day moving average. In the past, this indicator has detected local and macro cycle bottoms. It does fire more often than most other bottom indicators, so take it with a grain of salt.

Risk Mitigation Post | Possible BTC TopThis post presents a potential top for BTC Price Action (PA) for your confluence and Risk Mitigation.
I do not care if I am wrong, and invite constructive comments to improve the count and enable everyone a more holistic understanding of BTC PA, rather than destructive comments that do not achieve anything other than show the community the type of person your are.
The primary rationale for this count lies within the retracement on completion of the initial 5-Wave move up on completion of Primary WA.
From my perspective, this retracement exhibited insufficient depth to be counted as a W2.
Reverting to what I call the Elliott Wave Theory paradox, if it is not a W2, it must be a WB.
The targets presented in this chart may overshoot, however, I feel more confident in a new low, than an ATH on this move.
CRYPTOCAP:TOTAL was used to confirm this count.
Trade Safe.
TOTAL Chart:

Are you ready for Capitulation?I believe the ETF was simply a FOMO event to get exit liquidity for the big players, and the capitulation event of 2024 has been planned for the central banks, institutions to create a massive supply through liquidations

bitcoin lifetime scenario 2 Bitcoin is a decentralized cryptocurrency originally described in a 2008 whitepaper by a person, or group of people, using the alias Satoshi Nakamoto. It was launched soon after, in January 2009.

bitcoin lifetime scenario Bitcoin is a decentralized cryptocurrency originally described in a 2008 whitepaper by a person, or group of people, using the alias Satoshi Nakamoto. It was launched soon after, in January 2009.

BITCOIN pullback in 2024In the fog of war. The ETF shows the perception of future mass participation. We think the ETF is a buy, while Smart money sees this as a point of sale. Volatility will confuse the masses into selling at the wrong time like it has always happened. Fear will be the indicator on when to buy. Watch the news only to do the opposite or you will just donate more hard earned money. Wallstreet bets on when you will fail. In a bull market, is when you buy the dip.
Trade safe~
