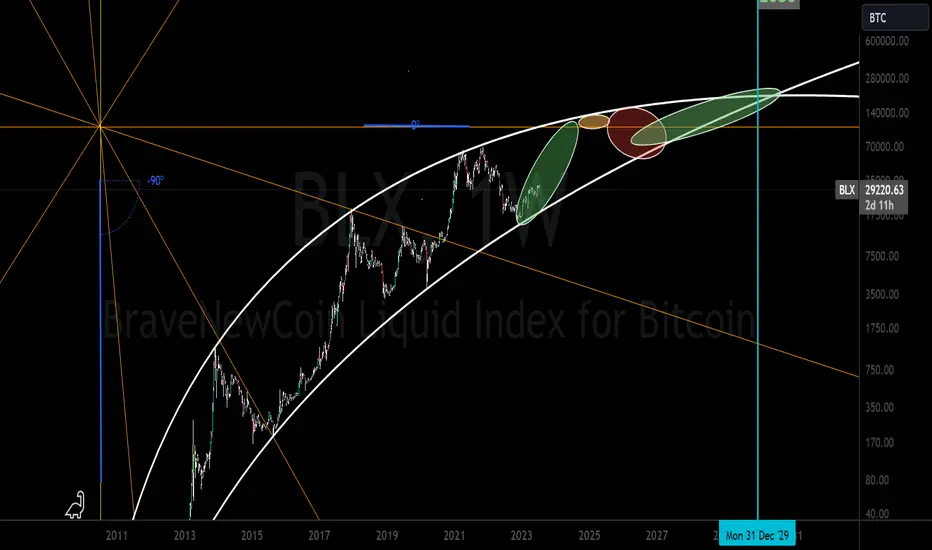
BTC Accumulation ZoneAs we see in the Long term every circle BTC have the :
Accumulation Zones
Distribution Zones
And Bear Zones
There is no reason for Panic you are already know that we arent in Alt Season.
Better to name it BTC Season right now.
So keep Calm and accumulate as much as you can
BLX trade ideas

BTC/USD - Jessie Livermore's ChartHey everyone, long time no see! I hope you're all doing well.
I was looking at some charts recently and I was struck by how similar the BTC chart is to Jessie Livermore's chart.
The BTC chart shows a similar pattern to Livermore's chart. There are periods of rapid growth followed by periods of consolidation. This is a classic pattern for a market that is in a bull trend.
I'm not saying that BTC is going to follow the same path as Livermore's chart. But the similarities are certainly worth noting. It's possible that BTC is in the early stages of a major bull market.
I'll keep you updated on my thoughts as the market develops.
In the meantime, stay safe and trade carefully!

Bitcoin Multiple Bullish TargetsThis is a follow up to my previous PnF chart targets with an added pattern that being a "Descending Broadening Wedge"!

Bullmarket Support Band flips BullishThe Bullmarket Support Band has historically acted as a support level for Bitcoin prices during bull markets.
It is a simple long TF indicator and price tends to retrace towards it. For example, during the 2017 bull run, Bitcoin had several 30-40% corrections to the support band.
WHY THIS MATTERS:
The band just "flipped bull" on the monthly timeframe after a long bear trend since February 2022.
On the weekly we had a perfect touch off the support band with a nice reaction to the upside.
Most importantly we had our first monthly close above the Support band since April 2022.
Last time this occured was October 2019 7 months prior to the May 2020 halvening and imo 1 year before the real bullmarket started in October 2020.
Now we are 8 months away from the predicted April 2024 Halvening.
After October 2019 the support band was pretty much respected with minor dips, other than the Black Swan of the Covid Crash.
History rhymes, you cannot trade solely of this indicator but it certainly tingles my BULL NUTS.
As for the Price I think the big boys wanna see more fomo longs and for that we will need to reach 33-35K and imo 40k is not out of the question.
Once that is achieved a Black Swan could be looming, who knows what. At this point we all know its a game, just make sure to know the rules and play along.
NOTE: The band is created by plotting the 20-week simple moving average (SMA) and the 21-week exponential moving average (EMA) on a weekly chart.

New Halving Analysistelling my friend how this halving gonna effect the btc price , but beware ; banks are entering !


Bitcoin bull market (pre-halving)Hi everyone,
When Pi Cycle bottom, which is a free indicator, cross up with 1 week candle and holdl support, there are great chances that the bottom is in.
As long as, red line hodl support we can see further upside price action. Even in 2019, when the price was rising for short time, red line showed danger as soon as the 1 week candle broke down and confirmed.
This cycle looks like 2015 cycle more than 2019 so $27.7k will be one important level to watch for next weeks.
Cheers!

Cleanest BTC chart EVERSuper clean BTC chart using only 2 indicators.
Accurately pinpoints tops and bottoms using the candle open (leading indicator).
Please see my previous post to see all the details:

BEST and EASIEST btc chart you will ever seeSelf explanatory... buy my indicator lol
In all seriousness though, I made an indicator that is fully customizable and can print however you want. As seen, this shows BTC has had its bottom.
Also I want to point out another simple yet major thing: BTC bottoms roughly 12 months after each market top. Using that knowledge combined with the forecasted lows via the indicator, you have roughly 2+ months to schedule an exact entry point.
And another one: Each cycle (top to top) is roughly 48 months.
Using the above info, you'd be invested 36 months on and 12 months off (Roughly)
Ex) You could schedule a buy for the candle 10 months after a BTC high to what the indicator tells you. If it hits, great. If it doesnt, do the same when the 6th candle (12th months after BTC high) prints. Rinse and repeat. This way you can do whatever you please with your successful investment 10+ months after the sell out date worry free of missing the next buy opportunity. You can also schedule your sells according to the indicator.
CLEAN VERSION:

Bitcoin's 4-Year Market Cycle TimingThis is just a fun chart to highlight the timing of the last two market cycles mainly.
When comparing the timing from one bottom to the next (which I consider a market cycle) you can see how close the last two cycles have been.
Also, when you compare the timing between the different events - Bottom to Halving - Halving to Peak - and Peak to Bottom, the timing is also very close there as well.
So far, it looks like the timing between the low set on November 21, 2022, and the next halving, which is estimated to take place sometime in mid-April, will again be very close to the last two cycles. We'll have to see if the timing of the rest of the market cycle is also close to the past two cycles.
Whether it plays out that way or not, it should be an amazing ride!
*Not financial advice*
Although the bottom was set back on November 21, 2022, and BTC has now pretty much doubled in price, there is still plenty of time to DCA into a nice BTC position for the next bull market. Many altcoins are still close to their bottoms, so anyone wanting to build altcoin positions also has plenty of time to DCA.

BTC Cycle Review: know when to hold 'em & when to fold 'emReviewing the time around the halving that produces profitable trending signals.
From the chart 1 yr and 2 months before the halving and 1 year 5 months after the halving produces profitable signals
consider pre halving to be spring
consider post halving to be summer
consider the red X between the two to be winter and unprofitable to take signals.
Posting this up as reference into the next cycle. interested to see how this plays out.

Are there really Cycles in the Crypto market?Are there really Cycles in the Crypto market?
Are there really cycles in the markets?
-Are cycles only in the stock market or in all walks of life?
-What is the use of understanding cycles?
-How is it always going up or not?
-If it always goes up, why do the majority lose?
-Is there a similarity? Does it always have to be similar?
-How do we recognize meaningful textures? How do we distinguish between cycles and meaningless similarities?
Are altoins long-term or cyclical?
-But could it be different this time?
Cycles and similarities actually exist in every aspect of life. In living beings, inanimate beings, radioactive elements, our planet, the universe, the devices we use, products, history, sports and the part that interests us - the markets.
As long as humans and markets exist, these cycles will continue. If human behavior is similar across time, the consequences of human behavior should be similar. So, what do we actually see in the graphs. "Consequences of human behavior
Within cycles, there will always be new winners and losers.
This is why the stock market exists. In order for the last losers to win, new last-comers must enter the market (new cycle).
Cycles in crypto are faster than in general markets. Cycles that used to take almost a human lifetime in classical exchanges, commodities and exchange rates have now been reduced to shorter periods due to the speed of life, the impact of technology and the increase in the number of investors.
Another reason for the speed in crypto is that the market can be traded 24/7 and 365 days a year. Within a year, we see more transactions and more movement in crypto than in other markets.
The crypto market is the most suitable market for the speed of the new world (technology-fashion-obsolescence-consumption speed, etc.) and reflects the speed of the age. Fast technology, fast fashion, fast communication, fast human relations, fast production-consumption; and of course fast MARKET.
The increase in speed in every aspect of life would of course also affect the markets. There are good and bad sides to this; very quick losses and very quick gains.
Reasons for rapid losses and gains:
a-) The market we are in is not regulated (rule-law),
b-) The fact that its technology is very new, that its technological part is understood only by a certain segment of the population, again speaking for the world in general; +
a very minority group is only capable of distinguishing right from wrong with their own analysis,
c-) With just a phone; it can be operated very simply by everyone (young, old, rich, poor, educated, uneducated, women, men, etc.) regardless of class, gender, age
What do I mean by the above?
a-) Lack of supervisory and regulatory rules; There are no regulations protecting investors in this market. In other words, our money is not protected or insured by any state-institution as of now.
As you know, when there are no rules and when there is big and easy money involved, people with bad intentions end up here. The fact that it's easy to issue tokens, that there are no rules for creating tokens, selling them, marketing them, advertising them
Limited number of shares in the stock exchanges and too many rules for going public (according to crypto=) ) So coins come out almost every minute. Exchanges can be easily opened in tax haven countries,
Easy (low-cost) listing of coins on decentralized exchanges or shitcoin exchanges. It is easy to issue and sell tokens as if you were creating an asset from scratch with no strings attached, and it is very easy to sell during bull periods,
No penalties for marketing and manipulating Shitcoins on Social Media. Since it is the most risk-averse market in the world, rug-pulling is considered normal by investors.
Experienced malicious people can make big profits in a short period of time at a low cost. (We have seen many examples of the bull, which we have seen many examples of before, hitting 4-5m USD with a cost of $ 50,000 and escaping - advertising, shilling, etc.).
b-) Incompetent people believe in everything and enter into direct transactions without knowing and learning (creating volume) (small money - many transactions) Experienced investors make fewer transactions with more information and analysis (big money - few transactions),
On the contrary, inadequate or new investors taking more transactions with sudden decisions and feelings, "More transactions, more money perception", stock market advertisements that push believers to make more transactions (Exchange = gettin commission income)
Are altoins long-term or cyclical?
To put it crudely: The more shitcoin an Altcoin is, the more cyclical it is (i.e. earn during the trend and run away when the trend ends). The more quality and proven Altcoin is, and the more it solves a problem, the more long-term it is.
You can look at Altcoin/btc parities to see what I mean. Very few Altcoins have been able to show a sustainable increase against BTC and only in certain periods.
Does the crypto market always have to grow?
Unless there are very harsh regulations or bans, "Yes" against paper currencies. it doesn't matter whether it is usd, eur or gbp.
Content of cycles:
Briefly: 3 periods Decline from peak > accumulation > ascent
Bottom level base formation, saw zone, pre-rally, disbelief, aggressive rally.
Afterwards, the cycle repeats according to the conditions of the coming days.
Although the cycles follow one another, each cycle is different from each other.
That is, the periods of decline-accumulation-rise can be of different lengths. Depending on the conditions of the period, there may have been a very long uptrend. This may be followed by a very long and sharp correction. At the end of a weak trend, the downturn may be short. We will examine the details on the charts.
When we enter the accumulation period, the price has realized the bottom formation and the products sold at the peak have started to be collected again at low cost by the big players (capital, whales, rich people, masons, 7 families ruling the world, whatever you want to call it:) ). This process can be long or short depending on the period (see chainlink)
Sometimes markets can recover quickly with a V shape (rapid decline-fast reaction) (covid period). Sometimes we see a saw in a certain narrow price range at the bottom. (Btc 2015-2016) The aim is to collect goods without raising the price and without making it obvious.
Understanding the cycle through Doge?
Dogecoin was launched in December 2013. In December this year, it will be 10 years old. That's a long time for the crypto market.
We have witnessed 3 different cycles of Doge in these 10 years.
1. Trend > It took 476 minutes to fall from its peak to its lowest point. It then rose from this point (not forming a new bottom) and accumulated. This up and down process lasted until February 2017. This is where the "doge-style bullish" phase, as we will later call it, began. In the region where this uptrend started, it gets support from the 100-week moving average (100w sma) and the move begins.
Level 1: peak zone
Level 2: Intermediate transition line (Important support-resistances are in place)
Level 3: Bottom and Accumulation bowl
2nd Trend > The uptrend that started in February 2017 continues until January 2018 with 2 stages. The 3-level structure is also seen here. The decline from the peak to the low lasts 798 days. The upward break of the trend lasts 910. Here, too, the region gets support from the 100-week moving average (100w sma) and aggressive action begins. We can say that the rise until May 2021 is again in 2 phases.
Trend 3 > Along with the whole market, Doge's trend turns bearish in May 2021. The lowest level we have seen so far in Doge within this trend is $0.05. 833 days have passed since the May 2021 peak. We are below the 100-week average and the average is now at $0.11.
What's important in this Dogecoin cycle chart;
3-level structure
Time from peak > trend breakout
Position relative to the 100-week moving average
Aggressive 2-stage bullish moves starting after the trend breakout.
Explaining it through Doge is easy for both the narrator and the reader. It shows the cycle clearly. I have prepared multiple doge charts, you can review them.
Are there similarities, and if so, do they always have to be similar?
Capturing similarities and using them meaningfully
Similarity does not always have to be in every product. Different actions may have taken place in very different scenarios. The important thing is to find the mathematically meaningful similarity and draw conclusions in a way that is useful to us.
Similarity is not just a resemblance of shape when viewed from a distance.
It must be confirmed in many ways and temporally proportional.
It should also be possible with important indicators such as Rsi and moving averages.
Just as technical analysis is not just 2 lines, similarity is not just a resemblance of shape.
It should also be kept in mind. Cycles and similarities are most meaningful on long-term charts
Siacoin
XRP/BTC
VERGE
Digibyte

Bitcoin BLX Bitcoin is probably going to 100.00$ 2025/2026. Never the less it'll be important for Bitcoin to top the last ath.
Let me know your thoughts on this in the comments.

Bitcoin in 2030As these Logarithmic Regression lines converge where will bitcoin go? Will bitcoin become more stable over time? Will it breakout of this formation? Is bitcoins source code designed to make it more stable over time e.g. miner hashrate & halvings?
I believe bitcoin is bullish until interest rate pause or cut. It will come out of no where probably this year (2023) so be careful. Also in the coming weeks we could see more sideways (august). see structure of prebullmarket 2020 (bart) and consolidation
BTC cant make up its mindSteadily creeping upwards for months now. BTC has hit the major level around 30k.
This resistance level is psychological (30k), it is the support we found in the summer of 2021 and it is also a .618 FIB level from the top of 2017 to 2019 bottom.
On the weekly BTC has been in an upwards trend (gray trend lines)trading above the Bullmarket support band.
There is a chance we crab more here and pop out to the upside which i believe will lead to 33k first and then 38k. Before that 27k not out of the picture. Break 26k and we see 22k.
Personally i think BTC will ultimately scoop the lower levels near 20-22k but first we need to trap more fomo longs, so move up to the 30s, trap longs, then blackswan/crash before halvening as is tradition.

Bitcoin 2022 Potential BottomI have realized that the Bitcoin cycle bottoms are characterized by the following:
- Weekly timeframe: Reverse PMAR & PMARP: Oversold or near oversold levels.
- Weekly timeframe: Hash Ribbons: Bottom is near a Capitulation signal.
- Bottom is historically 50 to 60 weeks after the Cycle Top.
- Bottom is historically 70 to 80 weeks before the Halving.
I think the bottom is already in when we dipped to $15k.

btcusdtBitcoin is suffering in a support and resistance area, the possibility of a strong pump and dump is not out of mind. This is only an analysis.

#BTC/USDT WEEKLY TA Roadmap till the EOY.Hello everyone, it's been a while.
The next five months will be very important if you are looking to do great in the next Bull Run.
There are many information given in this chart.
One needs to look closer and find out the details.
I will keep this chart posted for the next 2 years updating it once in a while.
I will provide some important information for now which might be beneficial for you.
1. The upcoming halving will act as a catalyst for price appreciation in the entire market. Before the halving happens, we won't see much appreciation in the price BER:33K being the primary resistance and FWB:42K the main resistance til the end of this year.
2. The market will not go as high as people think because of many fundamental reasons.
3. Derivatives have been a drawback for this market where retail trader loses and the HFs make money. This is the reason why we see manipulation in this market.
4. For the next 5 months Bitcoin could hit the low of $21800 to $25444. This might be the last time to buy Bitcoin below the $30k level.
5. The primary resistance here is BER:33K and FWB:42K is the most important one which BTC needs to break in order to enter a full-phase bullish rally.
6. I will post more updates on various altcoins in the coming days which have good potential both technically and fundamentally.
What do you think of this chart?
Do let me know in the comment section and hit the like button if you find it helpful in any way.
Also, thanks for your unwavering support over the last 7 years.
The upcoming Bull Run will change lives only if you know when to EXIT!
I will post more exit strategy charts this time which most people missed in the last Bull run.
Do share this chart with your friends who need this information.
Thank you
SET:PEACE
Cheers

End of Bitcoin cultureYou can hate me. That's cool. But it wouldn't stop it from dropping.
So you think because every tech guy and magazine and stupid believers said "BITCOIN WILL GROW FOR EVER", that will make it happen? Are we living in heaven ?! What about the fair value? Who do you want to sell to if there is no one to buy it from you?? Who are the buyers? of course whales. suppliers. they don't want you to hold and have BTC in your hands. They want to take it from you so they can make profit in longterm. you always look at charts (specially bitcoin) in a selfish way : "how I can make the most profit?". Do you think the whales won't think this way ...... ?
I will complete my view in this section .soon. More details and charts on the way.

Bitcoin history and future1W time frame
-
Every vertical dotted lines stand for halving timing, we call them "a cycle" between two lines.
Every cycles have similar trend, we can mark them with three colors as below.
(1) White range stand for Bull high to Bear second low
(2) Red range stand for Bull high to Bear low
(3) Green range stand for Bear low to Next halving
According to halving in 2012 and 2016, we can expect Bitcoin make a second low (below 20000) in near future, the most possible time range is from August '23 to February '24.
Before the second low coming, Bitcoin will likely reach price over 33000, therefore, be careful of being fomo and get ready with patience to buy spot.

The Market Requires A 100%+ Move - Will Buyers Save Bitcoin? Here on the left, I've shown the BLX chart (Bitcoin index with the longest price history, plus its log curve) and the broken long term uptrend on the Litecoin chart on the right. Why Litecoin? Well, the 2017 bull market was characterized by astronomical gains for Bitcoin alternatives. At that time, it was about which functioned as the best currency. Litecoin and others were seen as faster, cheaper alternatives to Bitcoin. Litecoin supporters mark a bit of a cross-over between those who believe proof-of-work offers the most secure, stable network and those who prioritize cheaper transactions. Although Litecoin and other currency competitors did well in 2017, they underperformed in 2021, outclassed by coins associated with DeFi, memes, NFT's, the metaverse, and staking. This past bull run was characterized by which had the best "value" proposition and/or the best memes. Needless to say, much of this has already gone up in smoke.
The issue is, the "currency" coins have not held value either, retreating all the way back to levels from the 2018-2019 bear market, while Bitcoin itself barely maintains its price above the 2017 all-time-high, between $19800 and $20100. Most people did not think this was possible a few months ago. Many were still convinced that Bitcoin would hold above $28800 and maintain a bullish trend. Litecoin has broken its long term uptrend, and arguably needs to go up a whopping 4x in value quickly in order to regain the trend. Yet, a currency does not necessarily need to appreciate in value over time. We're now in the utility phase - cryptocurrencies need to prove they have some sort of necessary use-case outside of value appreciation.
Speaking of long term value - we're now at a moment where if the bottom is NOT in , there's very little historical Bitcoin trend support until nearly $9k, where I've drawn my log curve. And I've drawn it generously - I've noticed that before this crash many were drawing their curve so it cut out the COVID crash, seeing it as an anomaly. But if that was an anomaly, what is today's price action?
For many participants in the crypto market, the bottom MUST be in, or at least we must be very close to it. Bitcoin likely could not experience anything greater than another 50% decline from the most recent low ($17600) before total implosion, at least according to the log curve. Some would argue that the market has already imploded, but it seems merely that the over-leveraged players are getting consumed by those with deeper pockets. Just because the smaller, riskier lenders have fallen, does not mean the market is immune to continued systemic risk. The bigger fish need to attract more buyers ASAP, and the bounce needs to be huge - I'm talking a 100% increase at minimum.
So then, the question becomes: What is the probability that Bitcoin will double from current prices and get back above the $40k level in coming weeks? I believe the market needs to see something like this, in order to prove it has any legitimacy as an "asset class." Otherwise, I think this was the final bubble for Bitcoin and crypto. I mean that seriously. Either of these scenarios would work, to inject confidence back in the market, though of course the blue is more severe.
As I've said in my recent posts, any kind of bounce would be perfectly reasonable from these levels - buyers, you're welcome to that $20k Bitcoin at any point....a lot of people are waiting for you *evil smirk, impersonating big exchanges*. My point is that the bounce needs some SERIOUS oooomph behind it. Rising slowly to $33-34k over the course of several weeks just wouldn't do the trick, and it would provide the opportunity for longer term moving averages to solidify themselves as resistance, and could even allow the 200 week MA to flatline and roll over to the downside.
TL/DR: Bitcoin needs to show buyers have strength to take it back to $40k+ quickly, even if it's just an initial impulse, to inject some confidence and liquidity back in the market.
Now, for the warning signs, and what limits the probability of a 100%+ up move.
BROKEN TRENDS
I'll begin by posting a chart of a seemingly random altcoin - TRX.
I think this one is significant because of Justin Sun's relationship to Binance, his own algorithmic stablecoin (USDD), and its apparent refusal to break down from its distribution range. Of the coins I've followed, its the only one that has not dropped substantially, although it finally broke its own uptrend. This shows there is still significant downside risk in pockets of the market.
Something I've been watching for roughly a year now is the ratio of Bitcoin against the S&P 500 index (SPX). It has now experienced an extended decline, interrupting a decade of outperformance.
Based on the above chart, Bitcoin needs to triple soon (at minimum) to regain the trendline and show strength against traditional assets. My theory (as it stands) was that Bitcoin only outperformed because the market expected it to become mainstream one day, and be touted by billionaires and celebrities. Now that it has achieved fame, there is not much to speculate on anymore.
Bitcoin also needs to move up substantially against Gold, in order to continue capturing the "store of value" market share. Currently, it's below the 2017 all-time high, and resting on the highs from mid-2019. Gold is dropping substantially at the moment, so this provides an opportunity for Bitcoin to show some relative strength. But does it have enough fuel to get back above 18-20x and the long term trendline?
If Bitcoin's value proposition TRULY lay in its scarcity, then why did the market find the need to create thousands of other coins? Humans are greedy and expansionist in nature. Sure, having a limited supply of something and conserving it can teach humans to save and to prepare for the future. But in the end, as I've said numerous times, cryptocurrencies are not a resource. Bitcoin *could* be a commodity, but again, the market does not see it as such, which can be viewed in the simple Bitcoin Dominance metric, and implied by its decline during a period of high inflation.
I find that the Bitcoin Maximalist ethos is really about preparing for disaster. But to me, the most important things one can do to prepare for disaster are: CONNECT WITH YOUR LOCAL COMMUNITIES IN PERSON, develop a valuable skill or trade, and manage your risk.
Interpersonal trust is extremely important. This is how movements and change occur, not by building a hypothetical simulation of trust through algorithms on the Internet.
In addition, BACK TO LITECOIN - this thing has now dropped all the way back to its accumulation range from the previous bear market, showing that the last halving did nothing to increase the long term price floor for the asset. Will the same happen to Bitcoin? Litecoin appears to be in danger of heading back to somewhere below $10, should it not QUADRUPLE in the coming weeks.
What does this all mean to the buyer?
This means it's time to position oneself relative to risk tolerance. If you feel there is even a slight probability crypto will be saved by the big buyers, then now seems a decent time to allocate whatever percentage of your liquid capital to this crazy market and just hope for the best. For me at the moment, that's a little under 5%. For some, 5% might be a lot, for others, not so much. The way I see it - if I'm going to increase my exposure back to something like 10%, that's risking 10% for the potential to double my entire capital, since many altcoin projects could rebound 10x from here. That's my absurd logic, and is clearly only gambling. So, in my trading, I'm still considering putting a little bit back into the market near current levels. Yet, something holds me back - I think it's that my belief in the space has waned over the last couple years and I don't see much meaning in buying anything for the long term at this point. I'd rather focus my resources elsewhere. Nevertheless, I continue to post on here, cataloguing my ever-evolving thoughts on the market, and the fascinating history of humankind.
This article represents the opinion of the author, and is not meant as financial advice. It is meant for speculation and entertainment only. Please consult with a professional financial advisor before making significant financial decisions.
-Victor Cobra

New Bull Run Is Gonna Start But Till When?I have split EMA 50/200 Golden Cross and Death Cross in 3D chart.
As we see we have bar/accumulation zone then we have bull run, for many people bull run means ATH but I don't think like this, it is a long term trend.
Trend will start soon even covid black swan couldn't make it death cross so this trend is %100 till now.
From 21.07.2023 our golden cross will start (hope so) and we will forward, first we should move at least %50 upside, correction. Retest for 200 EMA, probably will be somehere 30K then another steps up to upside.
Adoptation, instutions, goverments, metaverse, de-fi 2.0, AI, CBDC count as many things for your long term plans.
Till 2026 we have death cross time period so bull run might finish end of 2025 or early 2026.
So are you still afraid that Bitcoin gonna 10K?
There will many times to scared but not right now, please don't fomo in, don't all in. Crypto is risky asset.
Have a nice day, all of gonna be super rich!

Bitcoin 5-month lineBitcoin's 5-month line, the trend line above the main upward target, will reach the upper white line price within one or two years.
