Cyclical Nature of BitcoinToday, we'll take an in-depth look at Bitcoin and examine where we could be headed over the next few months. The chart before you is crystal clear: we are in the midst of a repeating cycle. Regardless of how bad the news may be, or how much global conflict or financial turmoil escalates, all that matters is the chart.
The chart speaks volumes: Bitcoin came back to the green zone in this model in precisely the same time as the last cycle: 364 days. Refer to this TA for more information on that:
So we hit the green zone, we've bounced out of it, hovering just above it, as we did in 2019. With last week's weekly close, we've broken the 0.25 Fibonacci fan, just as we did in 2019. So, unless we do something that changes the mirror fractal, we will continue to stick to the view that this relief rally is just getting started.
In 2019, it took us 56 days from the time we broke the 0.25 Fibonacci Fan to reach the relief rally top. If the same pattern holds, the week of April 10th, 2023, would signal the top, and we could go as high as $48k. Anywhere between $35-48k would be the topping zone. Somewhere within this yellow circle, around this time, would be the perfect topping signal for Bitcoin. However, things never go as planned, so we could top out as early as $35k.
Why $35k? Well, the highest CME gap currently sits at $35k, with the 0.382 Fibonacci Fib. This is an area that I'll be paying close attention to because it's very possible that Bitcoin will close the gap and top out for the year at this level.
If we zoom into the daily in 2019, we can see that we created an ascending channel coming out of capitulation. We have done precisely the same thing this cycle so far, but we will go one step further here.
This chart shows the Pearson correlation coefficient, demonstrating decoupling from the SPX500 vs. Bitcoin. When we dig in, we see that, in fact, Bitcoin decouples from the stock around precisely the same time during this ascending channel in 2019. The negative correlation lasts for a significant chunk of the relief rally, as you can see. Very interesting. Here we can see that during that period, the Dow Jones dropped 7.59%, while Bitcoin rallied 78%. It's essential to note that even though Bitcoin has become increasingly more correlated over the years as it matures, there are still pockets of the cycle where there is negative correlation.
Bitcoin has been performing consistently within the same bands as it did in 2019, a fact that remains true since the publication of the TA above from eight months ago. This post, published during the bear market, was met with skepticism and laughter from traders who claimed that the "MACRO ENVIRONMENT" would prevent the predicted outcome. However, the theory, vision, and analysis presented in the post remains valid and unchanged to this day. By removing the noise and emotions surrounding human behavior, we can stick to the chart and better predict market trends.
Mayer Multiple Bands
Bitcoin still playing within the same bands as 2019 perfectly .
Of course, there's always a possibility that I am wrong. What if we're not going to have a relief rally, and this is the top? The invalidation level is always present, and nothing is ever 100% guaranteed.
Looking at the fractal pattern that emerged during the 2015 bear market, we can see that history could repeat itself. While anything is possible, including a black swan event that could bring the market down in a week, I think the odds of this fractal pattern playing out are low, at around 10%.
In every cycle, Bitcoin puts in a "marco double bottom." Even in 2011, Bitcoin put in a double bottom. Having cash on hand for when those two bottoms hit is essential. I believe we have only had one bottom, and while some analyses bet on the FTX black swan being the second bottom, I disagree.
After the COVID crash in March 2020, I spent countless hours trying to predict when the next Bitcoin crash would occur. I was off by two weeks when I published my analysis in January 2022, but we did get the first cycle bottom around the end of May 2022.
The only constant pattern we have is that Bitcoin puts in the second double bottom before the next halving, which is scheduled for April 2024. The average length from the second double bottom to halving is 256 days, and according to my analysis, sometime between July 24th, 2022, and April 2024, we're likely to get Bitcoin's double bottom, which would bring the price down to at least test the first bottom lows at $15k.
My Bitcoin model predicted the pico bottom of the COVID crash in 2020, and if it follows the same pattern, the latest low band of the model will be retesting $15k is April 2024, which is the same month as the halving. Keep in mind that these are projected lines for this model, and if anyone is a coder who can add projected dash lines to the model, please DM me on TradingView.
Another possible outcome for the double bottom of Bitcoin could be a crash as early as July 2023.
As long as Bitcoin stays within this ascending channel, we have the potential to push much higher. However, if we break out of the channel and close below it on a daily timeframe, the chances of the 2015 fractal playing out become much higher.
BLX trade ideas

HOW QUANTITATIVE TIGHTENING AND HALVING AFFECT BITCOINDear Traders,
An update on my previous chart, as the overall cycle broke down, also note that we may not get a large Christmas Rally as we have in the past, but the chart shows there is potential.
Here is the explanation of the break down on a pattern I have noticed between QUANTITATIVE TIGHTENING and the BITCOIN HALVING (HALVENING) CYCLE.
Quantitative Tightening is basically a way of cutting the money supply to the economy by increasing interest rates, usually to curve inflation. Usually, after 18 months of interest rate rises, inflation eases the market cash flow returns.
As shown in the chart, the BITCOIN cycle from havlening to bull run is approx 18-24months followed by QT 5-6 months later with 6-12months bear market then the cycle repeats.
DAY 0 - HALVENING
then 18-24 months of BULL MARKET
around the 30 months mark QUANTITIVE TIGHTENING FOLLOWED CLOSELY BY BEAR MARKET
48 months (4 years) NEXT HALVENING
CYCLE REPEATS
At the bottom of the Market, there is also usually some type of BLACK SWAN EVENT.
January 2015 GREECE, CHINA CRISIS, OIL hit 11-year lows, the world shaken by Paris terrorist attacks.
December 2018 USA Trade war with China, FAANG under scrutiny
MARCH 2020 CORONAVIRUS
MARCH-MAY 2023? Potential Factors - CHINA Economic Crash, US/China War over Taiwan, Death of UK Queen.
Thanks for Reading and please let me know your thoughts
<3 Lisa

BTC Macro Price Action Highs and Lows!Bitcoin macro long term price action , based on wyckoff analysis. Highs and Lows in 2023 and 2024.

THIS IS THE ENDI wont even bother explaining why
We are headed into a great depression that will dwarf all the so called recessions we had
the 90 year secular bull market has ended and we are in the early phase of a bearish supercycle
from an elliot wave standpoint possibly a leading broadening wedge for wave (A) of the initial Double zig zag correction towards the downside
expect war and chaos to ensue
better find a bunker and hide .
ITs going to get real UGLY

BTC Wyckoff Prediction?This predication will probably only be true if we hold $18000+ but has an uncanny resemblance to the link below as shown by Wyckoff Point and Figure (P&F) Count Guide example for the Dow Jones Industrial Index!
school.stockcharts.com

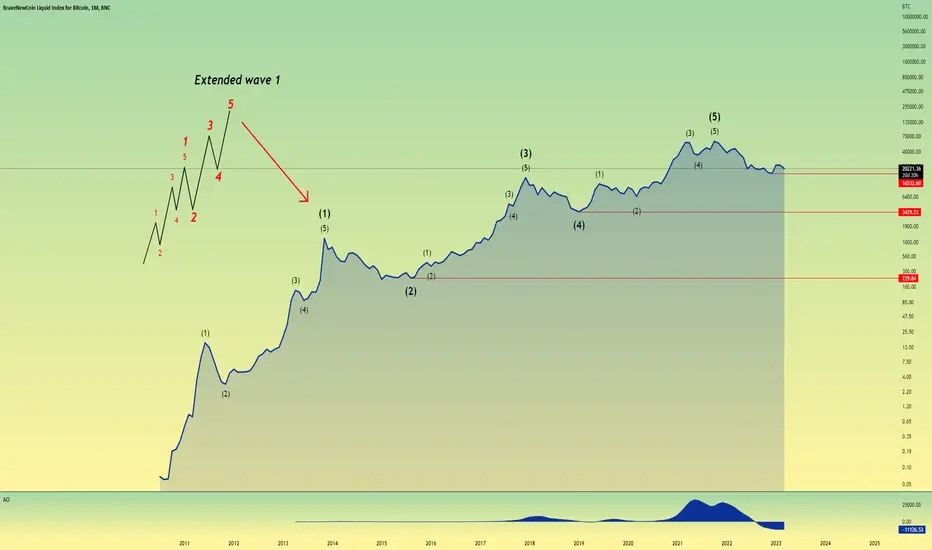
Inception Wave Count - And the start of a new Bull Cycle.So after going over BTC inception data I've come to the conclusion that this is the correct wave count, I'm of the belief that BTC has already made it's cycle bottom and we're early stages of a new Bull Cycle which will last many years, These 5 waves up all complete a larger degree wave 1 and the correction we've had will be wave 2 of a larger degree (providing the bottom is in) - if this is correct we're in a wave 3 of larger degree.
LFB: That's one small step for man, one giant leap for mankindTargets:
TP: 13.4K
TP: 9.8K
TP: 5.4K
SL: 21.3K
Reasoning:
1. Ema crossover
2. Fib Circles
3. Descending Channel
4. Banks
5. Timing - Global Shifts - Politcs - liquidations
Not financial advise and not to be construed as such, I'm not a financial adviser or trader licensed by any organization nor do I claim to be. These are the thoughts, beliefs, and opinion for why I am shorting the 20K level.

Accurate, Holy, Most Disgusting Bitcoin Bottom PredictionBased on real facts, real math, real time travel evidence. The Bitcoin bottom is at 12k

BTC ATH 10-11.2025 Cena 76,5 tys. - 81,5 tys.Simple math
Divide the previous % ATH by 5.3
It was first observed at Crypto Crew University

Baby's First Recession.Bitcoin's first recession. Bids at 6400.
LOG Fed funds rate is at the bottom panel. Never seen rates this high, will be interesting to see how high they can go, I'm estimating 7.5% before they pull back.

Buying region at 20k to hold long-term post halving for BTCBuying region at 20k to hold long-term post halving for BTC
A good purchase of BTC would be in the region of 20k.
Halving 2016
After the bottom, 525 days to halving
Best buy in Golden Pocket
Halving 2020
After the bottom, 504 days to halving
Best buy in Golden Pocket
Halving 2024
After the bottom, 553 days to halving
Best buy in Golden Pocket
Based on the logarithmic curve of BTC as support, we can estimate that buying BTC in the region of 20k is a good option for the long term.
If BTC seeks the region of 12k, it will be another good time to buy more BTC.
This strategy involves buying BTC after a significant price drop (bottom) and during a specific period of time before the halving, which is a reduction in the reward that BTC miners receive for validating transactions on the network. Halvings usually lead to scarcity of BTC and therefore can lead to an increase in the asset's price.

Monthly DOJI rejection of long term trend line Just printed a monthly doji rejecting the long term trend line which we have been below for months.
The break below the trend line could be an indication of a new pattern forming on Bitcoin. The DOJI rejection seems to confirm this. If we have a follow through red month close for March then we are likely in some new phase for Bitcoin which would make sense given the Global Macro bearish environment with recession to come. End of the 90 year cycle, end of the 49 year cycle of declining yields which ended in 2020. The period most similar is the Great Depression. If we don't break above this trend line and instead continue lower along with a breakdown in equities. Could this mark a more significant decline for Bitcoin?
Sure would be a perfect setup to usher in CBDC as crypto is deemed too risky for investors.

AW Bitcoin Analysis - Part 2 of 2 - The Larger Degree...This video takes every piece of analysis I have ever done into consideration.
It takes the most likely pieces of analysis and makes sense of them using the AriasWave methodology.
Complex and corrective fractal patterns that are choppy aren't the easiest to gauge straight away.
Therefore, I outline a few different options for what we could be seeing unfold for the first part of this bear market.
This idea also points out that this correction is only just getting started since the highs and backs up those claims with some evidence.
This type of understanding of the entire structure lays down the foundation for the potential scenarios that are coming.
Each of the scenario's points to lower prices from this point forward.
Take whatever you can from this and make your own decision on where the next low may be.
I will post more about these ideas over the next few days.
I have linked the small degree view below which points to the third-of-a-third wave scenario given the structure.
Remember to use Disciplined Money Management Principles to ensure longevity as a trader.
If you don't know the long term pattern shouldn't you be doing your research instead of just following the crowd?
Just remember: I am not a financial adviser; I suggest using this only as a guide. Always do your own research.
***AriasWave is not the same as Elliott Wave so your counts may differ to mine if you happen to use it.***

Spider lines from 2015 2016 bear markeMost draw the lines from 2018 but went back and did it from the prior bear market and levels have been respected.


AW Bitcoin - The Most Bullish Idea Yet - Still Needs More Work..In this video I talk about how I am building up a library of patterns in my mind similar to machine learning.
This is why overtime my analysis changes and evolves into these ideas.
The more I post, the more I learn because I am actively learning different examples of a wave components every day.
The sooner you start the process of learning the waves, the quicker you will start to see the matrix for what it is.
I am not trying to say that I am some kind of all knowing super human because I created AriasWave.
No, I am simply harnessing the very same abilities that we are all born with.
Just like a computer processes data by utilizing the CPU, Memory and Storage, we too can do the same if we know how.
AriasWave is just the program that provides the instructions to perform the analysis.
Remember to use Disciplined Money Management Principles to ensure longevity as a trader.
If you don't know the long term pattern shouldn't you be doing your research instead of just following the crowd?
Just remember: I am not a financial adviser; I suggest using this only as a guide. Always do your own research.
***AriasWave is not the same as Elliott Wave so your counts may differ to mine if you happen to use it.***

Protection against a Bitcoin bottom or riding the capitulationI strongly believe we are in the topping process of this Bitcoin move. If Bitcoin has bottomed I expect to either: retest the weekly 21EMA (currently at 19900 or 20300 when we get to it) or retest the 17800-18100 zone.
I am still expecting capitulation which could bring us to 14k and give us a rebound as a corrective move only to fall lower into the 8k target zone for when recession kicks in late 2023/ early 2024
My process is to play both sides and build shorts from 23400-26200
TP33% of Short and Hedge Long#1 at 21 weekly ema
TP50% of remaining Short and Hedge Long#2 at 17900
TP100% of remaining short at 14500
$14500 - $7300: DCA buying opportunity of a lifetime (no leverage)
Stop losses:
Short: 26600
Long: 16900

BITCOIN: DAY OF REKTCONINGThe reason I think Bitcoin may drop to $3000 or below is because it double topped and because it fell out of an upward channel that it had been in since 2011, these are both strong bearish signs.
Bitcoin had a very nice run, but nothing goes up forever. This may be a wakeup call for a lot of Bitcoin Maxi's and anyone in the cryptosphere. This day of rektconing would most likely be the much needed purge the crypto space has needed. Anything of value will survive, but everything else would mostly die off and regulation may step in as well to ensure this.
If this happens ETH may do well and take the alt coins with it, but BTC could also bring down ETH with it, or the flippening may occur, I'm not really sure.
I think the Terra Luna, Celsius, and FTX crash is the writing on the wall. Strap in and prepare yourself, this time the rockets not going to the moon, but re-entering the stratosphere.

BTC vs. S&P 500: Will Bitcoin pull off the Houdini trick again?What is really happening with Bitcoin right now, where is the capital flowing in the markets?
Most of the money is flowing into the stock markets and other forms of investment, including crypto.
The chart shows how Bitcoin has performed so far compared to equities. Will Bitcoin pull off the Houdini trick again?
Time will tell. I think we are at a crossroads.

Bitcoin poops off unbelievablyUnfortunately, the great master of escape has run out of steam this time...
Already in August 2022 it should have become clear that Bitcoin is only a charade and is on a downward path.

Expanded Flat Correction lines up with Various Pattern TargetsHere's a more bullish chart for Bitcoin, should the expanded flat correction play out and take us to a new ATH:
*** This idea requires DXY to turn back and continue its downtrend, a resumed uptrend would likely negate this ***
Expanded Flat stopped just below the 1.618 on the trend-based fib measurement (logarithmic), first stop after crossing ATH and 100% would be ~87500 at the -0.382 fib, then ~105k at -0.618, ~144k at the ~100%, and potentially even ~237k at the -1.618
All of the above (expanded flat fib extension) lines up with several common pattern targets and the fib retracement from our previous March 2020 low to our last ATH:
1.) 2018-20 Triangle - has a measured 1x TP 1 at 81k, very near the 87.5k target mentioned above. Then a 1.5x TP 2 at 241k, which very nearly matches the 1.414 fib retracement @ 225k and the expanded flat's trend-based -1.618 fib extension at 237k.
2.) Present Weekly Falling Wedge - has a measured 1.5x TP 2 at 87k, matching the expanded flat target at -0.382. The 2x measured target is at ~141k, less than 3k under the -100% trend-based fib ext from the expanded flat.
3.) The entire idea above fits perfectly into a logarithmic parallel channel uptrend.
I've drawn a couple of suggested paths here within the channel, one not reaching channel top and the other reaching top, both then heading to channel bottom. If the move stays within the channel through 2025-2026, it could reach 323k.

Bitcoin - BTC 🟢step 1 is done 🟠step 2 in progressBitcoin
Using RSI & SMA delta Indicator by MarcoValente (changed settings)...
🟢step 1 is done
🟠step 2 in progress (close above 0.50)
Next BTC bullish run ahead dear Crypto Nation❓🚀
Let me know your thoughts in the comments🤗
⬇️⬇️⬇️
Likes and Follow for updates appreciated🤗
Disclaimer:
Not financial advice
Do your own research before investing
The content shared is for educational purposes only and is my personal opinion
