BRAVE NEW COIN TOP (EXPERIMENTAL)BNC:BLX
It's important to note that cryptocurrency markets are highly volatile, and such forecasts are speculative. Investors should conduct thorough research and consider their risk tolerance before making investment decisions.
BLX trade ideas

CYCLE 4 | Price %Change Extension from 20W SMABTC PRICE %Δ EXTENSION FROM 20W SMA ANALYSIS
Similar to previous Analysis looking at 'Price %Change Extensions' from moving averages (see links below), we take a look at the respective relationship BTC has held with the 20W SMA over its existence.
HISTORICAL BEHAVIOUR
Observable in Prior cycles BTC has topped and bottom out at High Points and Low Point of this relationship. We can see over cycle periods the highs are sloping downward (indicating ATH of future cycles diminishing in nature is historically in line with this relationship). This is observable via the downward sloping green zone connecting cycle peaks in the BTC Price %Δ Extension from 20W SMA.
For cycle bottoms (excluding the bloodbath of cycle 0), generally we see these occur ~around the 80% Price %Δ Extension region (see the red box below).
CYCLE 3 VARIATIONS | THIS TIME WAS DIFFERENT
It is notable that Cycle 3 was the first cycle where the high and low in this relationship occurred before the price All Time Low and High of Cycle 3, and in this instance the indicator displayed more divergent behavior (suggesting price momentum is reversing) with spikes of a lower high and higher low of this relationship indicating cycle 3 ATH and ATL.
CYCLE 4 ATH TAKEAWAYS
* A revisit of the Green Zone has historically coincided with a significant top or cycle ATH with prior price cycles.
* If Cycle 3 behavior is the new norm, then a revisit of the green area may indicate price momentum reversal. This divergent behavior indicated BTC was setting the final ATH for cycle 3.
* Either scenarios may play out again in Cycle 4 and may be a usual relationship to use with confluence of other relationships to identify Price / Market timing to take final profits.
See Relevant Previous Posts Below

Bitcoin goin to 130k by the weekendread the text on the chart
the title is not facts and is clickbait so many ppl see this important information.
Beware that a user on X is stealing many analyst's work from trading view and posting it as his own
his details are on the chart and what you should do.

Bitcoin Bullish Fractal vs. April 2011 - Up OnlyBitcoin is attempting to break out of a 6-month consolidation. This is the 2nd base from the bottom, very similar to the price action in 2011. It has also completed the same 7-wave correction. This fractal suggests that Bitcoin may go up only from here.

MicroStrategy - Bitcoin Holdings Chart & Purchase HistoryPrices and volumes of Bitcoin purchases at MicroStrategy
Over 9k BTC at an average price of 58000. 19452 Btc at $52765.
Even these whales are buying at the tops and sitting in the minuses for years
The largest holder of Bitcoin on the planet is not Microstrategy , but the Chinese government, cryptoanalysts found (twitter.com/cryptoquant_com).
In 2019, Chinese authorities confiscated 194 thousand #BTC , 833 thousand #ETH and other coins as a result of an investigation into PlusToken fraud. To this day, the confiscated crypto lies in the wallets of China's national treasury.
In comparison, MicroStrategy has about 130,000 bitcoins .
27 march
MicroStrategy repaid its $205M Silvergate loan at a 22% discount . As of 3/23/23, $MSTR acquired an additional ~6,455 bitcoins for ~$150M at an average of ~$23,238 per #bitcoin & held ~138,955 BTC acquired for ~$4.14B at an average of ~$29,817 per bitcoin .
Best regards EXCAVO

BLX LONG-TERM FIBS Fibs in on either axis give meaningful, useful, and accurate levels for price and time, but do not tell you which levels are most important. Use with you own judgement. Basis for 0,1 origin points can also be subjective and produce differing results on the x,y, axis
Bitcoin's HistoryThis chart shows the cyclicality and history of Bitcoin's price action since it's inception.

BTC has one more leg upBitcoin is currently range-bound and hasn't broken above resistance. In the coming months, be ready for a move higher towards 125-150k. This is the level I'm predicting to be cycle top.
Cyclical analysis tells us this should occur around fall-winter of 2025. I'll be updating this chart as we near cycle top. For now, this is a potential re-entry point <100k
The next bear market will be steeper than most people think in my opinion.

Crucial point for Bitcoin on the 3 week chartThis 21 day chart shows the green price ranges drop happens every time the white RSI line touches the yellow rsi line. Minimum drop is around 25%.
As you can see 3 times it signalled the top was in and bear market to start. However on the RSI we can see that it has not got that shaded green area similar to every other bull run.
The yellow price range on chart signals current candle drop whilst the orange price range shows the potential minimum should this play out as described.
Each price drop is measured from candle at touch on RSI to the very next candle only.
From this we can deduct that a huge bounce from here is about to happen to restart the last leg up and form the shaded green area on rsi, or
price will drop minimum 25% which is another 11% from current price. From there price moves up to continue bull run or we enter the bear market cycle.

600k in 2029? Alot going on in this chart. I looked at the difference in percentage increase between tops of bull runs, length of bull runs, and halvening dates to try estimate possible targets of this and the next bull run.
I took the 42% decrease in the difference between the first bull run and applied that to the other bull runs. If you look at the covid year 2020, take the covid drop % and add it to the top of the the bull run that year it gets close to that 42% decrease from the increase before. Continued to apply that 42% decrease in percentage growth and got an estimated target of around 260K towards the fall of this year. Looking bull run time length increasing each on as well.
Then did the same for the next bull run as well.
This is just for fun showing a possibility! GL Everyone

The Bitcoin Peak: When Will the Cycle End?Been a while since I published a TA. I’ve been digging deep trying to decipher when the cycle top will come in for Bitcoin. Some say it’s an impossible feat. Well, let’s give it a go.
There are two major dates and one minor date for a possible cycle top:
May 2025
**Volume Flow**: 1157 Days
**From June Bottom**: 1064 days
**ETH clear bottom**: June 2022
**Bar Pattern Fractal**: From 2015 bottom
**221k Price Target**: Target crosses with the model in May.
September 2025
**From November Bottom**: 1064 days
**Major Macro Time Fibonacci**
**Chainlink Fractal**
**Chainlink Time Fib**
March 2025
**Small Time Fibonacci**
**Bull Flag End**
**Average % move and time since 2019**
As you can see, there is a lot of evidence to unpack here, so it’s going to be a long one. Let’s start with the first date: May 2025.
---
May 2025
Volume Flow on Heikin Candles on the Monthly shows that from the Bearish cross to the cycle top is 1126 days, which ends up being May.
Every cycle, Bitcoin has always put in a double bottom to mark its cycle low. As you can see, in 2022 we had two major crashes, and even though it’s not 100% clear here, we got a double bottom.
The amazing thing about the first bottom in June 2022 is that it mirrored the first bottom of the cycle low of 2015. That fractal was a mirror, showing the importance of this first low in Bitcoin in June 2022.
If we overlay the 2015 fractal, we get the top coming in May.
For anyone who doesn’t know, the last two cycles, Bitcoin has taken 1064 days from Cycle Low to Cycle Top. 1064 days from the June 2022 low is May.
ETH has a much clearer bottom than Bitcoin this cycle. It also took 1064 days, which puts it in May.
So you can see, there is a lot of evidence pointing towards a May 2025 Cycle Top for Bitcoin.
---
September/October 2025
1064 days from the second bottom in November 2022 would be October 2025.
For years, I have been using this Major Macro Time Fibonacci sequence that shows me important moments in Bitcoin’s cycles. The last pointed to a move down to 48k in August 2023, which is hard to see on the 2Week chart.
As you can see, it comes close to pinpointing moves, so the next date is the end of September 2025, which lines up with the 1064 days from November 2022.
I have been following this Chainlink fractal for more than a year. We traded LINK using this fractal back in October 2023. You can check my TAs from that period. The fractal is still valid and tops in September 2025.
Chainlink Fibonacci Time Sequence has been hitting home runs time and time again, from pinpointing the top all the way down to the bottom. The next date is late August 2025, very close to September 2025.
---
March 2025
This date has far less weight for a cycle top but could be part of a major local top and correction.
A small Time Fibonacci sequence taken from this level shows that March 31st is the next date, and the one after that is late August 2025, the same as the Chainlink fractal.
240% over 162 days is the average that Bitcoin moves up since 2019. If we just overlay the average, we get 127k by mid-February 2025.
A mirror move from October 2023 to March 2024 puts us in March 2025.
---
Elliott Wave Section
I’m not an expert in this field but will throw in some takes.
Could we possibly be in Wave 4 out of 5?
Or could we be finishing Wave 3 right now and in for the first large correction of this bull market?
The fact is, the last time we hit this band on this model was January 2021. After that, there was a 31% correction lasting 31 days.
Sometimes 5 waves are very clear. Take GOLD, for example: there is a clear 5-wave pattern at max Fibonacci extension. This is a massive macro sell signal, in my opinion. Crazy how GOLD hit this level on Wave 5 as Bitcoin breaks 100k.
---
### **Price Targets
If we take the first cycle and overlay to 2015 cycle, it gave us the cycle top in 2021.
If we do the same for this cycle and overlay the 2015 cycle, we get a price target of 221k, which puts it at the top of my model in May 2025. Just discovered this—that’s one more point for May 2025.
As you can see, in the last two cycles it worked. Will it work this time? Who knows.
---
Pi Cycle Indicator
If we just run a rough projection on when the next cross will be, it crosses in April 2025, very close to May. Keep in mind this is a very rough idea of when it could cross.
---
Conclusion
We have 5 points in favor of May 2025, 4 points in favor of September 2025, and 2 points for March 2025. As always, the path is never clear for Bitcoin. Until we get much further down the road, I won’t conclusively know which date it will be.
This model I have been using has been so accurate thus far. We are so high up the last bands that we are most likely going to get some sort of long consolidation period with a correction soon, which would give the altcoin market a run.

Bitcoin monthly candle close above 100K! it might be bad newsHallo. last time bitcoin closed monthly candles above 10 100 1000 10000 dollars it resulted in huge pullbacks. please watch this video. No one is talking about this

Bitcoin 32O,OOO$ on cycle 2025.Just look at BTC from 2019 year. It was the bottom and next pump started. We are in a bullish trend still but soon the trend will finish.
Bottom 2019 - ATH 2021
Bottom 2022 - ATH 2025 ?
4 years cycle)
It will be great time to buy more altcoins. Also you can look and analize others idea.

Graphic of showing bitcoin bear season starting pointAs you can see,BTC finishes its bull run at the white line. for now there is still some space till white line.

Bitcoin accurate bottom and top zones
BINANCE:BTCUSDT
This is my market mood indicator. Accurate determine the bottoms and top of cycles.
Based on this analysis on BLX chart and Monthly timeframe we can find something interesting
- Marked Monthly green zones.
- We never seen white color disbeliefe zones.
- Previews 3 times when we saw BLUE color it was a bottom (I was impressed how accurate it play out!!!)
- Now it looks like 2018-2019 period (green box-blue-green)
- So now no euphoria on market. Need to see yellow, orange and top will be again at extreme red
- Hard to say about timing but most likely we will test trendLine at 35-36 (maybe with fake out to 41)
- Then we will see yellow and orange color on indicator and drop to covid trendLines again 21-19 and continue move forward till 2025 March to extreme RED zones and end of cycle.
Hope you enjoyed the content I created, You can support with your likes and comments this idea so more people can watch!
✅Disclaimer: Please be aware of the risks involved in trading. This idea was made for educational purposes only not for financial Investment Purposes.
---
• Look at my ideas about interesting altcoins in the related section down below ↓
• For more ideas please hit "Like" and "Follow"!

BTC ALL TIME HIGH AND REVERSALBTC all time for 2025 reversal and manipulation and then the low calculated since the start of btc and the low of 0.01$ till now

Bitcoin - Lofty Promises, Disturbing Results: My Crypto Journey.I make no claim to know where Bitcoin is headed. All I know is my opinion on it, and my feelings about cryptocurrencies in general, especially how they've evolved over the years. My sense continues to tell me that things are very wrong with crypto, and that eventually it's going to fade into the uncomfortable past, a kind of failed experiment. Back in 2022, I thought that if it gets bigger and bigger, it's a general symptom of wealth concentration, exploitation, and mass delusion. I don't think this technology is beneficial to society, as it extracts both attention and resources from its participants. Unless, of course, you can manage to be one of those who profits and then turns their profits into material wealth and/or positive change.
Looking at my own personal timeline for my sentiment about crypto, let's see how I ended up here:
November, 2017 : I am out of college for over a year now. I've been working a tough sales job for a year and I'm beginning to get burned out. I hear about Bitcoin from a friend. "if you buy in at $10K, sell at $20k and double your money." I then learn about Bitcoin and think, well, things are pretty bleak in the world right now. I don't know what I'm doing with my life. What if the banks collapse and I'm left with nothing? Bitcoin seems like a viable alternative. I buy out of fear, around $13.8k. Then, I see my value go up. Greed takes over. I go down a rabbit hole, learning about altcoins such as XRP, XLM, and LTC. Even XRB, which later becomes Nano. What if any of these becomes the next Bitcoin?
January, 2018: I think that I should have just cashed out. I must have bought the top. But, what if it all comes back even stronger? I could be rich. I pull out part of my initial investment and watch the rest continue to spiral downwards. I quit my job out of burnout.
May, 2018: Bitcoin continues to make lower highs. I start working that crazy sales job again part-time, as I need the money while the bear market persists.
December, 2018: All hope seems lost. I quit my sales job, again out of burnout and deciding I don't want to do this the rest of my life. I'm 25 years old. Then, I decide to look for reasons price might go up again, which would also then save me from having to go back to work again. I could just be an artist full time. I get into TA, thinking that it's kind of like art. Instead of working on my actual art or writing as much as I want to, I create all sorts of trendlines and other visual and fundamental reasons crypto could come back even stronger than before. I prepare. I buy ETH around $100. I'm now posting regularly on TradingView. I start figuring out which coins I want to load up on for the next bull run.
April, 2019: The market is back. I'm pretty sure the bottom is in. I'm gonna make it. I continue to post about various cryptocurrencies on tradingview, although I begin to feel worried about altcoins. Will they survive through the next cycle?
October, 2019: The market is volatile. Bitcoin finally hits $10K again, though there's something strange going on. Is price being manipulated?
February, 2020: Things are starting to feel precarious. ETH has done better now, boosting my portfolio back towards break even for the first time. The COVID crash is immanent. I've decided on a career to pursue.
March, 2020: Panic. Markets are screwed. I'm going down with the ship. I'm too scared to buy more because everything feels apocalyptic.
September, 2020: I begin grad school. While working mostly from home and attending classes remotely, I have a lot of time on my hands to post crypto analysis. I want to invest more, but I have very little income as a student. I feel that price is about to explode upwards. However, in grad school I'm also learning a lot about systems and becoming more and more skeptical about whether crypto would bring about any positive change to financial systems.
February, 2021: ETH has broken all-time high. I'm in significant profit. I'm checking my portfolio all the time. Will the altcoins rally soon?
Spring - Summer 2021: There's a huge amount of dumping. What's going on here? Why does Elon Musk have so much influence over this market? I thought it was supposed to be decentralized. Tweets are having a huge effect on the market. Should I sell? No, I think it's just a correction. I'm right, at least for now.
December, 2021: I'm feeling pretty bullish. Bitcoin made a significant new all-time high. But, something is tingling underneath my skin. I can't quite shake it. What's going on with this LUNA coin? A number of things are starting to unravel in my mind. For example, El Salvador recently made Bitcoin legal tender, but the response was very tepid. It's not seeming very practical at all. If it's not a viable currency, then what is it? I think about Elon Musk. I think about Michael Saylor and his defrauding of investors during the dotcom boom. I allow the cognitive dissonance I've been experiencing completely take over.
January - February, 2022: My feelings culminate. I decide to let go of all my crypto, realizing that it's not playing out ideally how I'd hoped. Plus, I'm in significant profit now. The forces that have taken advantage and control in traditional markets and the broader economy have latched themselves onto the cryptocurrency market, where investors are easily exploitable. The Super Bowl happens. Crypto starts to feel more and more like a joke. Who is really profiting from all this? NFT's are also irking me.
May, 2022: I finish grad school. Terra LUNA collapses, shortly after I speculated it would. For the rest of the year, I feel validated in my feelings about crypto. FTX collapses later that year, and although in hindsight it marked the bottom of the bear market, I'm hopeful that people will stay far away from this market in years to come. I am optimistic about my own financial future, as I now have a stable career. Later in the year, I make some money day trading, but I eventually stop since it's distracting me from my work.
July, 2023: I continue with my new career in the mental health field. I'm 30 years old. XRP was deemed not a security when sold to retail investors, but a security when sold to initial institutional investors. I am disappointed in this outcome, as I disagree and believe many altcoins like XRP are clear securities. I'm glad to be paying less attention to the crypto market.
January, 2024: Against my speculation and to my disappointment, Bitcoin ETF's are approved. I stubbornly stay away from the market, believing the ETFs to be another cash grab and an opportunity for existing holders to cash out, particularly those whales who have been on the stablecoin side of things - the orchestrators behind USDD, USDT, etcetera.
August, 2024: Ripple is only fined a tiny fraction of the initial request by the SEC for selling unlicensed securities. This opens the floodgates for money to pour back into altcoins, and for more ETFs to eventually be created.
November, 2024: Bitcoin finally makes a significant new all-time high after Trump is re-elected. It had been consolidating for much of the year, seeming at times that it would break down and not push past its previous high.
January, 2025: Trump is back in office. There's volatility across the market. Many are hopeful that his presidency will bear fruit for crypto holders. Meanwhile, he creates his own meme tokens and profits enormously from them, not unlike the numerous crypto grifters from years past, the grifters that took hold of the market and told me to stay away. I feel upset that price went against my speculation, though also vindicated. Crypto is exactly what I realized it was. My opinion has not changed. It's just another bulky asset, though one where the corruption is far more transparent than it is in the world of traditional finance. Even though it's there for all to see, not much is being done about it. Typical, really, of this current era of deregulation and apathy. Michael Saylor continues to hoard more and more. It's just the plaything of the wealthy now. It's what some people always wanted Bitcoin to become, but the antithesis of what many thought it represented.
I'm happy with my career, and I feel good knowing I invested in myself and did not continue to chase cryptocurrencies. After all, it's better to be able to generate capital myself than wait for someone else to do it for me. It's a more certain future for me, with much less speculation. I'm also able to pay off everything from grad school with my profits from the last bull market.
Bitcoin active addresses have not grown since 2017. studio.glassnode.com
It is hoarding, and hoarding through custodians. Plus, those who were already into it just kept buying. A few left entirely. And a few wealthy players began accumulating.
Now for a little TA:
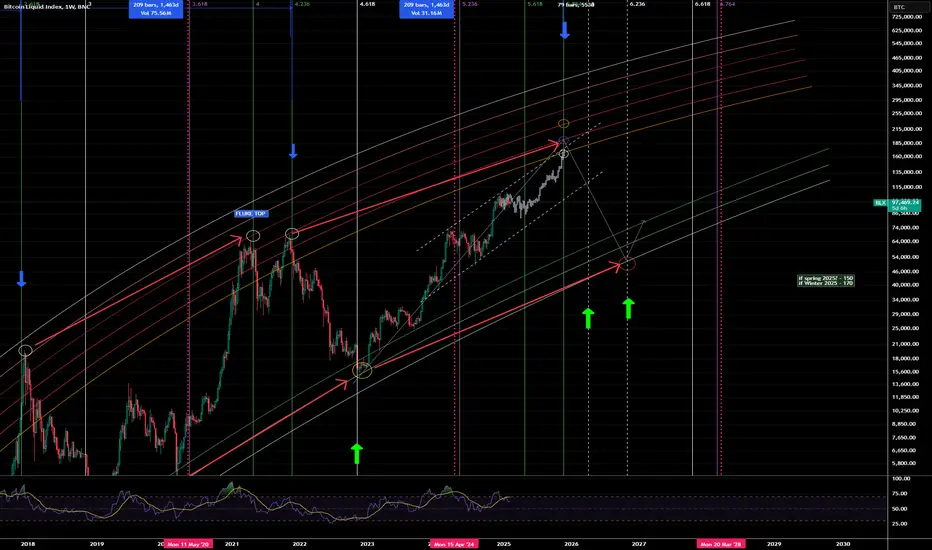
This is the structure I'm looking at for Bitcoin. Failure to push back above that orange trendline has resulted in a rejection so far. This chart should give an idea as to the various extremes price can take over the coming days/weeks:
This is the longer term BLX chart, showing diminishing returns curved trendlines. If Bitcoin continues to follow this shape, the peak could be limited to $160-170K if reached this year. That is, if it has not already hit the top.
The bottom of this structure is comfortably at a major level - near $30k.
This bullish structure would need to break down to confirm a bearish period:
Right now, the chart LOOKS bullish, but it's important to pay attention to the other signals, the other things going on behind the scenes. Public perception is important as well. The monthly chart appears bullish until the 9 EMA (near $80k now) is lost. The ultimate oscillator continues to show a longer term bearish divergence:
The weekly chart can look like a tweezer top with a failed high if price cannot push back above $108k later this week.
If that push up is successful, I think price can rally up towards $160k before profit taking begins in real earnest again.
Let's see what happens!
Thank you for going on this journey with me, especially if you've followed me since the earlier days. As always, this post represents my personal opinion and is in no way intended as financial advice.
-Victor Cobra

Bitcoin Cycle Top Discussion IITLDR:
Cycle Top Price: Between 123K (min.) and 144K (max.)
Cycle Top Time: Between mid-March and early April.
Bitcoin Cycle Top Price:
Bitcoin Primary Count:
Currently, Bitcoin is in the final stages of Primary Wave 5. The price has already reached the 1:1 Fibonacci extension and will likely extend higher. The following Fib extensions are:
1. 272 at 123.6K.
2. 1.382 at 130K.
3. 1.618 at 143.7K.
The primary 1.272 extension corresponds with the intermediate degree wave five target, establishing it as the most probable cycle top price.
Figure 1: Bitcoin Primary Wave Count.
Figure 2: Bitcoin Intermediate Wave 5 Count.
Bitcoin cycle Top Time:
The common practice in EW theory is to measure the 1.272 Fibonacci time extension of wave 4. According to the primary count, the Fibonacci 1.272-time ratio points to February 10th. According to the intermediate count, the Fibonacci 1.272-time ratio points to February 18th.
Figure 3: Bitcoin cycle Top Time – Primary Count.
Figure 4: Bitcoin Cycle Top Time – Intermediate Count.
Bitcoin Cycle Top According to Yearly Cycles:
The last four years have shown an interesting phenomenon. Bitcoin reached a significant top between mid-March and Early April. Should this trend persist, I expect the next cycle to top between mid-March and early April.
Figure 5: Bitcoin Yearly Cycle Tops.
Bitcoin Cycle Top According to the 4-Year Cycle:
If the March top is THE cycle top, what about the 4-year cycle? Bitcoin will likely form a higher price in an irregular correction by the end of 2025. If this scenario comes to pass, it will be in line with the 4-year cycle. The previous 4-year cycle top of 69K was also an overshooting wave B. Time will tell how the PA will evolve, but this scenario is highly likely.
Figure 6: Bitcoin 4-Year Cycle Top 2021.
If you read this post until the end, I appreciate your diligence. I hope it will be useful information that will help you make the most out 2025.
Best wishes
NTC

End of An EraBitcoin was born in 2009 in a 0-interest rate environment. This extremely speculative environment allowed assets like bitcoin to make crazy gains as loose monetary policy following the 2008 financial crisis gave everyone free cash to over-inflate asset valuations.
Interest rates are no longer at 0 and are only climbing higher. This shakes the underlying foundation of speculative markets like bitcoin that enabled this crazy growth in the first place.
In 2022 when the feds hiked interest rates aggressively for the first time in bitcoins lifetime, bitcoin dumped 75% in a single year. This was only a small taste of how the feds can affect these speculative markets and as they hike rates higher and higher Bitcoin will only aggressively dump more.
I think 5k-20k is a fair value range for Bitcoin. Also there is a massive double top.

Is it true that $BTC correlates with M2? Spoiler alert: not real
🗣In the last month, I have seen a hyper-fixation on the correlation of M2 with Bitcoin, as in red analysis with predictions such as a failure under 60K in February.
I don't entirely agree with this analysis.
📍First, most of the analyses I have seen show such a correlation only for the last year (black frame). Do you know why? Because in previous years, the correlations were many times smaller, and you cannot make such good matches.
📍Second, you can look at the white square. There is not too much logic in Bitcoin perfectly following the outdated money metric. In 2022, Bitcoin fell from 50K to 20K while M2 continued to grow, a three-month lead there does not really fit.
💡To sum up, M2 sometimes correlates with Bitcoin, but it is not often, and the 3-month shift is nothing more than a convenient data fit. You need to look at the big picture and not fall in love with one model or metric.

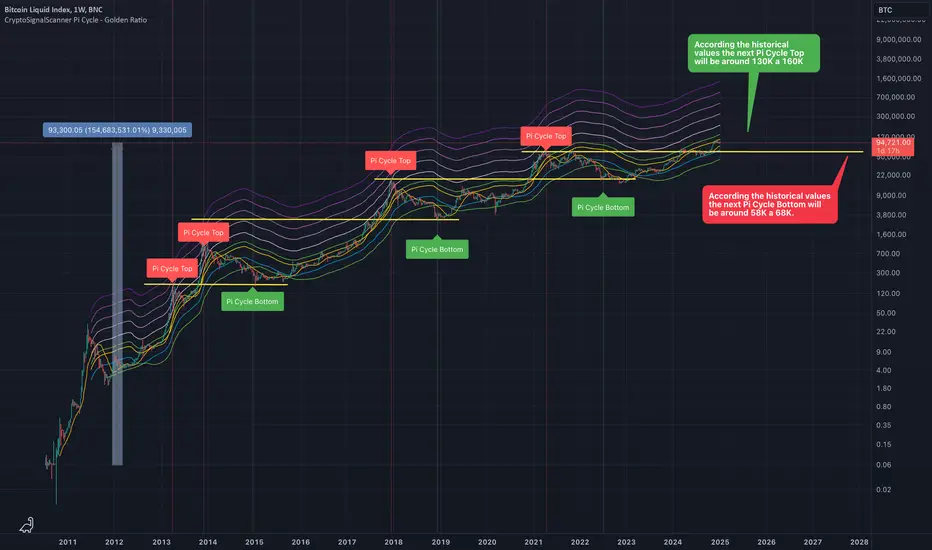
Next PI Cycle Top and BottomApproximately every four years, we observe a PI Cycle Top, and similarly, every four years, we see a PI Cycle Bottom. This means there is roughly a two-year gap between the PI Cycle Top and Bottom. Based on historical data, the next PI Cycle Top, expected in 2025, will likely fall between $130K and $160K. Following this peak, we can anticipate around two years before reaching the next PI Cycle Bottom. Historically, the PI Cycle Bottom tends to align closely with the previous cycle's Top, which would place it in the range of $58K to $68K. However, it's important to note that these are not fixed predictions but rather a brief analysis based on historical trends.
All you need for Bitcoin to see top, bottom or a crash.These charts show everything you will ever need to buy and sell Bitcoin.
5 day BTC chart.(right chart)
Orange vertical lines on chart show when the RSI touches the pink horizontal line after it touches the top red horizontal line. This indicates a bear market.
Yellow vertical lines on chart show when RSI rose above orange line after touching the blue line but failed to touch the red horizontal line before hitting the pink horizontal line. This indicates a crash is coming.
The green arrows on chart show whenever the blue EMA8 goes below the yellow MA55 after being above it.
This indicates either BTC has entered a bear market or a crash like setup similar to covid. If we get another green arrow you will know what to do as it will be a crash or bear market.
The green trendlines on chart show each bull run Bitcoin touches this trendline 3 times or more before it has a parabolic move. The anamoly being the covid crash. So far this bull run it is only twice that Bitcoin has touched the green trendline.
On the LMACD the green vertical lines show everytime the 5day LMACD crosses down (blue LMACD line going under orange LMACD line) when it is above the horizontal yellow line. This has happened 21 times with only 1 time (red vertical line) where price did not drop to the EMA21 (orange moving average line) on the chart.
BTC just did this cross on LMACD so it has a 95% chance of moving down to touch the orange EMA21.
Based off all this clear evidence it is easy to see that you sell Bitcoin when RSI hits red horizontal line. Confirmation of bear market is as per indicators mentioned above.
You buy when RSI touches blue horizontal line.
You won't sell the exact top or buy the exact bottom but very close to it. You would need a different chart to calculate the exact top.
This chart will stand the test of time if history keeps rhyming for Bitcoin.
Monthly BTC chart.(left chart)
On the monthly chart the orange vertical lines indicate whenever the Stoch RSI went above the green horizontal line. The yellow vertical line on the chart shows the covid crash as the Stoch RSI did not stay above the green horizontal line for very long.
The green arrow on the Stoch RSI shows when it fell straight through the red horizontal line after being above the green horizontal line. This indicated a bear market.
The pink arrows on the Stoch RSI show the crossover of the Stoch RSI (blue RSI line crosses under orange RSI line) after it fell below the green horizontal line and bounced off the blue or red horizontal lines. This indicated the top and a bear market.
After seeing this current information on the Stoch RSI (bounce off blue line) it looks like the upcoming crossover will be a pink arrow.
These arrows indicate time to exit the market as you can see.

Bitcoin cycle topIt works until it doesn't. The previous cycle trend support acts as a resistance in the following cycle. Covid panic sell off in 2020 was a deviation. The top should come within the first half (starts with the halving) of the cycle.
