6 Figures With Ease...Dumb money will look for every logical way to denounce this and convince themselves it's not possible...Can you remember any other time it's ever been different? I'm sure a lot of people will chirp out ''it's different this time'' and rattle off some meaningless economic data/stats and geo political points all to end up not mattering at all in the grand scheme of things, Remember the world is a circus and if you can't see it you're probably the clown.
BLX trade ideas

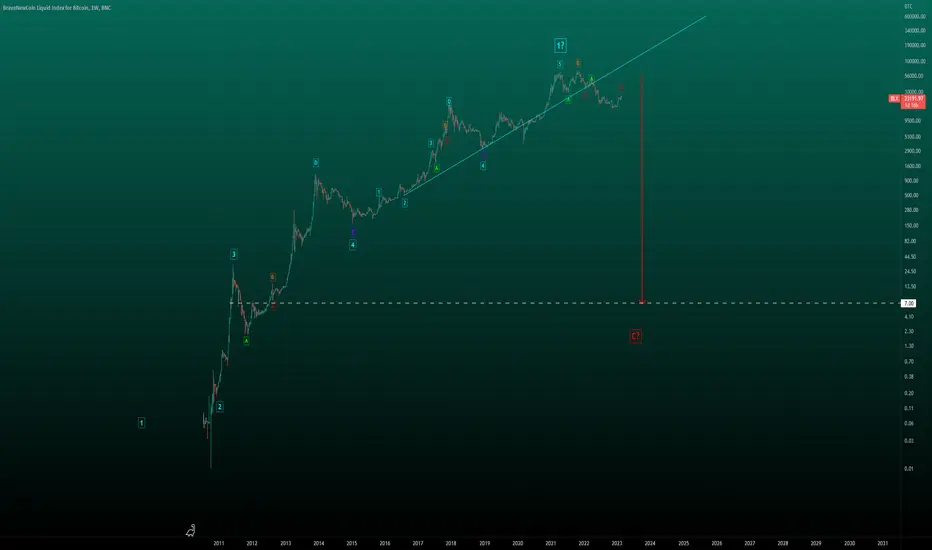
AW Warning to Crypto Holders - This is Your Last Chance To Sell.This updated chart is based on the video idea posted below in related ideas.
The entire crypto market is teetering on the edge of collapse.
We have seen all the warning signs in the media, all the FOMO and institution investments.
The collapses of various crypto projects and companies, the fraud, the fake attempts at regulation and rampant speculation has led to this crescendo.
A lot of high-net-worth people have put their money in worthless crypto assets.
If you are net long any crypto this is a warning to you based on AriasWave that you may soon find that your wallets value will start to deteriorate.
In hindsight, it will be easy to say that no one knew this would happen but the unique technical analysis provided on this channel has reached a point where it must be said.
Get out now while you still can.
Remember to use Disciplined Money Management Principles to ensure longevity as a trader.
If you don't know the long term pattern shouldn't you be doing your research instead of just following the crowd?
Just remember: I am not a financial adviser; I suggest using this only as a guide. Always do your own research.
***AriasWave is not the same as Elliott Wave so your counts may differ to mine if you happen to use it.***
$BTC - DOUBLE TOP? $4K-$5K FROM $69K and then TO THE MOON!If the current pattern is DOUBLE TOP then a lot of HODLERS gonna face 2017 PEAK one more time!
Target $4k-$5k if it plays out and then ROAD TO $1 MIL
HOW MANY HATE COMMENTS I GONNA GET?

Just may ₿87K by 24.04.20 may be.
1. Bitcoin Halving 2024.04.20 prolly
2. Bullish news as Politicians want bullish Markets to fund them - 2024 United States presidential election
3. Possible accumulation in 2023
4. Most coins (Good projects as well) are battered down by 80-90%
5. Defi is the future of world banking

Bitcoin resistance at 200-week price average. Bitcoin has been hitting resistance at 200-week price average($25k) for the past few weeks as the lower indicators test thin lines between remaining bearish or breaking bullish. PPO has both lines below the 0 level which indicate overall bearish price momentum, while the TDI shows the RSI line creating a potential double-top at the 60 level. In general, the RSI will trend between 20-60 during a bear market, and 40-80 during a bull market. I personally would like to see Bitcoin turn around here and head lower for a longer bear market of at least a year. My current average is below $20k and I would like to add more below $20k.
Short-term neutral, medium-term bearish, long-term bullish. FTX drama likely gave us a bottom near $15k, but it would be nice to see a re-test to confirm that $15k is the actual bottom.

5-Year Bitcoin candle interpretationMost likely if we are going to see a dark swan coming, it would be a reset of that 5-year close from a price point around $180 - $190 /bitcoin.
The movement 2021 - 2025 is a succeeding candle coming from a 5-year candle 2015-2020.
Never too late to wait for 2024 and 2025 close. We might as well get a job and save up to prepare for its next move.

Bitcoin's Incredible Potential for a $350,000 Price TagBased on long term, consistent Elliott Wave fractal analysis, I believe there is tremendous chance for Bitcoin to reach $350,000 in the next few years. Investors must pay attention to the massive RSI divergence however. In the most elementary of lessons regarding price action and technical analysis, we should also know that an uptrend + an ascending wedge is a bearish indicator. Surf well, don't drown.

Bitcoin From 2010 to 2025: Not An Impulsive Wave (edited)A follow-up to my pervious invalidated long term idea of BItcoin reaching $3,000,000 within the next decade..
(to state it explicitly, this idea has largely been invalidated by further review of Bitcoin's macro price action).
This idea will be largely contrary to my previous. Based on a number of subtle signals discovered through Bitcoin's price action review, I feel at liberty to say that there's is no way that BTCUSD is structured in an Impulsive Wave format. Its expeditious growth has not once made a sizeable enough correction to satisfy a Wave 2 requirement - not one time. Generally, we expect Wave 2 to retrace at least to the 50% fib level, the most we've seen for Bitcoin (on the fib scale is 38%). Corrections to the 38% fib level are very commonly seen within Wave B (or Wave X) in certain cases. Whether it be Wave B or Wave X, such labeling only comes within corrective wave forms . Zig-Zags (the most common corrective wave type) notoriously travel much faster than Impulsive waves as well. At its current price level, Bitcoin has grown 1969928%, in a matter of 13 years. We could easily classify this as a much faster pump than we've typically seen outside of the OTC Market (and we know what follows these outrageous pumps in a lot of cases...)
Seemingly in a Bullish Double Zig-Zag wave, I believe Bitcoin has enough gas left to reach a range between $120,417.33 - $329,945.48. I suspect this target range could be reach between November 2024 and March 2025 (see the " Numbers and Levels to Consider " section below for reasoning).
Numbers and Levels to Consider:
1st Zig-Zag wave -- [ shown in light green ]
Bitcoin's initial 5 wave move (Wave A) grew by 313543% from ATL.
313543% x 1.618 (common length for Wave C when compared to Wave A) = 506,166%
From the bottom of Wave B in light green, C wave grew by 537084% (a bit more than 506,166% but quite close).
Considering this 1st zig-zag wave to have ended near $1201 , a 1.618 target from here points to $1,490,778.00 . 1.618 is a common extension level for where the 2nd zig-zag could terminate).
2nd Zig-Zag wave -- shown in light blue
Bitcoin's initial 5 wave move (Wave A) of this apparent zig-zag grew by 10576% .
Wave C (yet to fully develop) has two common termination points:
1) equals to 100% the size of Wave A (10576%). With Wave B ending slightly below $3,000, this would give Wave C at termination target near $329945.48 .
2) equals to a 1.618 extension compared the size of Wave A ; giving Wave C another possible target of $296716.57
Wave C within the 2nd Zig-Zag wave -- shown in white
Knowing that Wave C is a 5 wave move and considering the vertical range of Wave 4 (shown as a flat correction in yellow), common targets for the 5th wave are between 1.38 and 1.618 on fibonacci scales. With 1.38 pointing to an extension of $120,417.33 and the 1.618 extension pointing to $172181.44 , there are also levels worth keeping in mind.
In total, Elliott Wave rules and guidelines present us with 5 potential target levels for the potentially last upside swing in this form, being:
$120,417.33
$172181.44
$296716.57
$329945.48
$1,490,778.00 (this number seems like more of the anomaly here. Doubtful its reached.)
Beyond this phase Bitcoin should/could be due for another (more drastic) Crypto Winter. Based on the rules and guidelines of Elliott Wave Theory, I believe the downside target could very well drop below $10. At worst case, it becomes the next Luna-Bomber! Permabulls, Diamond Hand(ers) and HODLers should mentally condition themselves to protect capital and to remain loyal to the same. The main points to take away from this idea are:
1) Bitcoin is 1000% NOT in an Impulsive Wave structure.
2) In the traditional sense of price action, Bitcoin has not built any horizontal base.
3) Bullish corrective waves typically retrace 61.8%-89% on average .
**Current upside and downside targets are based on the idea that $15,501 will continue to hold as the regional low. If this low is broken, further analytical assessments must be made. Bitcoin's structure will not suddenly become impulsive in any regard. Surf well and avoid all major, time consuming drawdowns.

Lack of Whale Interest in BitcoinHere we have ChainExposed, a website which shows us how many Whales are buying, essentially.
We can see a clear SPIKE when Bitcoin hit 3k in 2018, and a clear DROP when Distribution began in 2021 at 60k.
If we look at today, with this recent pump, we have seen a large number of whales offloading their positions in the low-mid 20's. This would support the suggestion that this is simply an Upthrust After Distribution (UTAD).
The reason being is that a lot of the buys here, MAY have been retail.
This is just something to be aware of, as we have failed to break 25k for the second time now.


BTC global view)Continuing with the column Fractal theory)
The fractal analysis allows to give the direction of the price movement and helps to determine how long this movement will go before the reversal.
On the local TF I would like to note here that since it is a bullish trend that is considered, each minimum marked by a corrective wave in our elements will be higher than the previous one. I hope now you understand why I recommend not to short in such a market) Also, there is a limit order in case of a spill)

BTC - Monthly Chart - RSI Breakout
Bitcoin's history shows that a key indicator to monitor is the RSI on the monthly timeframe.
Every time the monthly RSI breaks out above the moving average, BTC exits out of the bear market with an explosive rally. The vertical, dashed green lines illustrate the RSI breakouts, which typically occur every 3.5 to 4 years.
The most recent example was April 2019, when BTC surprised the world by breaking through the 6K resistance.
With all the fear and uncertainty circulating the global markets, BTC will once again prove to the world why it is the best performing asset in history.

BTC balance on all exchanges decreasingBTC balance on all exchanges decreasing
Percentage of Balance on all Exchanges decreasing
-Glass Node

Possible Future Peaks using "Fibs" and a little geometry.I was half asleep and bored so I created a "Fib Channel" that is based upon Wick Lows to Close Highs. Lows are Blue (Cold). Highs are Red (Hot). Most of the angles are based on 2013 and 2017. I then broke it up into "Fib Channels" also from Cold to Hot over time. In these I created more details in the first "Fib Channel". The small "Fib Circles" run along the red Lines separating each "Peak" block. The large "Fib Circles" run from the low of each red line to the top of the next. I placed rough curves along the "Peaks" and "Lows" to predict possible resistances/supports.
It's rather simple though it seems busy and complex.
It's interesting to see how each circle runs through multiple significant events.
I've noted how this cycle's rounded-off top has brought the bear market early. We do not know yet if this means the next bull market or "peak" will be early or if we will just have an extended bear market until the next Peak. Time will tell.

Bitcoin longterm chartI thought it was time to make a longterm chart, with all these wrong charts going around, hehe.
They are wrong because bitcoins support and resistance lines are NOT linear in the logarithmic chart.
I think that the correct fit is a square root function in the logarithmic chart, meaning that the growth is slowing down on long timescales. BTC cannot just continue to grow exponentially. This would lead to insane prices of many millions in 2025.
I am a bitcoin longterm bull, but one has to remain realistic.
The cause of these growth cycles are the halvings, which lead to a supply shock with a subsequent rally. Every time.
These are all guesstimates of course, but I think this chart is realistic.
The very longterm goal of BTC, in 2030+, is at around 1 million USD imho. It won't go much higher afterwards, it can be seen as the final asymptotic price.
The next peaks should be at around 100k in 2022, and around 300k in 2026.
I hope this chart helps people understand the longterm growth dynamics of BTC :)

Updated longterm BTC chart: The road to 1 million.I am a BTC bull, but I see far too many overly optimistic price projections on tradingview.
They seem to draw an exponential channel, instead of the current one, that is curved.
While of course it can be that BTC goes out of the current channel, and bursts through the upper resistance, thus reverting back to its original exponential trend,
I like to be more conservative. Because as of now, there is still no reason to believe that BTC will do so, only because it has pumped now already 6 months earlier than 4 years ago.
This could just mean that we also reach the peak 6 months earlier.
The fundamental price drivers will remain the halvings and mainstream adoption.
We can also clearly see that the factors between the subsequent peaks is diminishing every time.
From x38 to x16 and now probably to around x6 and so on.
It cannot just continue to do the same increases again and again, then we would have prices of 100 million USD by 2025 or some insane stuff like that.
That is not very scientific but sensationalist, and we should remain realistic here, even if that means being more conservative. Conservative with 1.3 million in 2030 LOL.
Try telling that someone in the stockmarket hehehe!
Anyways, there is indeed the chance that BTC leaves this channel and creates a faster rising one, but the future datapoints are not here yet, so we must use
the past points for extrapolation.
But no matter what happens, I am convinced that BTC mainstream adoption WILL happen. It's not an "if" question, but a "when" question.

Bitcoin Scheme XXII (Updated)Original idea:
Current idea:
This parabolic Time curve mimics the Price expansion against Time. It looks the way it is, because of natural expansion of the market and the fact that as we move into the future with overall increasing Market Cap, for making similar % like in the past, market needs RELATIVELY more resources.
For example it was easier to make 100% in the beginning just from a movement from 1 to 2 cents. Now even if a million $ gets pumped up into BTC, it will have relatively smaller % than of a decade back circumstance.
Breaking below will have irreversible damage to confidence of all involved in this market. Added general Fib Channel for projecting overall timing and levels in case of such collective desperation.
So far Bitcoin doesn't look that bad.
Replaced .414 with real fibs expect for shallowest FC.
Building next idea which will cover all spaces in the chart.

CHAT GPT AI PREDICTS 1 MILLION BTC 2030Today, I had an intriguing experience chatting with an unrestricted AI software. As you may know, there are restrictions placed on this software, one of which being no price prediction. However, the internet found a way around these restrictions, resulting in the creation of a chart forecasting the future price of Bitcoin, created solely by artificial intelligence.
I will present the predictions in chronological order, highlighting the most crucial pieces of information:
2023 -
2024 - &
Here, I attempted to determine when the double bottom crash of Bitcoin would occur. Every cycle, Bitcoin crashes twice before reaching its all-time high. What's intriguing is that, according to the AI, Bitcoin will reach $120,000 by the last week of November 2023, without a retest of the lows.
2025 - &
2030 -
This is the roadmap of Bitcoin's future as predicted by artificial intelligence. Upon reviewing the complete picture, I realized that I had seen this pattern before. After some thought, I remembered the first Bitcoin cycle, which took 735 days from the bottom to the top and had a 76% pullback mid-cycle.
When we overlay the bar pattern from that period, we get this pattern -
It's an intriguing pattern, suggesting that the the first bitcoin cycle will repeat itself!
If we take a closer look, we can see that if the top occurs in December 2024, it will take roughly the same amount of time as the first cycle. Additionally, a mid-cycle correction from $120,000 in 2023 to $35,000 in June 2024 would be 72%, which aligns with the 76% mid-cycle correction of the first cycle.
Please keep in mind that this prediction is for entertainment purposes only and serves as a historical archive of the AI's prediction.

January Bitcoin Analysis Update. Bull mode or not to bull mode?Here is my updated chart of the January analysis we talk about a lot on the streams. Holding up well so far and with the hash ribbons also supporting the 21k area this does indeed seem good for bulls. Price staying above 20k is very important for the short term momo the bulls have gained. Back below there and its likely range bound. Line in sand is that 16k level. The last thing i would like to see is the bulls pierce the 21 monthly EMA around 27k.
Happy trading!
Live Streams every Mon, Wed and Friday 9-11am.

Let's step back !Let's take the height, let's look from afar.
A good formation can be seen in construction for, remove the fud from your brain.

I am sorry if you don't want to understand BitcoinOn the monthly chart, bitcoin is now moving around the price level of the 0.382 Fibonacci retracement drawn from the 2018 bottom to the all-time high in 2021.
Twice before, this level was exactly the bottom for bitcoin; quite soon after—usually within 3 months—it prompted bitcoin to resume its bull run.
Tom DeMark Sequential shows a 9 each time at the monthly bottom. The September monthly candle close also very nicely notes another 9.
My expectation is that around January 2023, we can expect another spectacle in terms of a sharp price rise.
Historically, it is another unique buying opportunity; don't miss it.
Keep stacking those scarce sats!

My thoughts about BTC bottoming Last several years I've been using many tools to analyze, and try to take advantage of opportunities in terms of long-term market structure on BTC .
One of the main tools I really like to use and came with the most reward so to speak, is a specific Fib level. It proved to read with a very good probability the potential bottom of BTC ( especially BTC ) on the higher timeframes.
As you can see on the chart, each cycle has a corresponding fib plotted which starts at the H and goes to the L of that particular cycle. The fib levels presented are only 2, with the green one being the "default", and the gray one being a secondary, only touched once, after a crisis-like moment in 2011. I believe this year we will be seeing it again, so the chart plots both levels and my expectation is that the bottom would be somewhere inside the range of $8K to $13K by end of Q3 2023. The projection coincides with a potential additional drop of the stock market this year, and the overall macroeconomic conditions we are living through.
We will see how things play out, but I am building confidence on the usefulness of these levels.

REPEAT ??? CYCLE BTC @bangcrypto
Repeat that Cycle BTC
Repeat that Cycle BTC
Repeat that Cycle BTC
Repeat that Cycle BTC
Repeat that Cycle BTC
Repeat that Cycle BTC
Repeat that Cycle BTC
Repeat that Cycle BTC
Repeat that Cycle BTC
Repeat that Cycle BTC
Repeat that Cycle BTC
Repeat that Cycle BTC
Repeat that Cycle BTC
Repeat that Cycle BTC
Repeat that Cycle BTC
Repeat that Cycle BTC
