Bitcoin BTC/USDTesting/tracking elliot wave theory. Please do not trade off idea without S/L. Not financial advice.
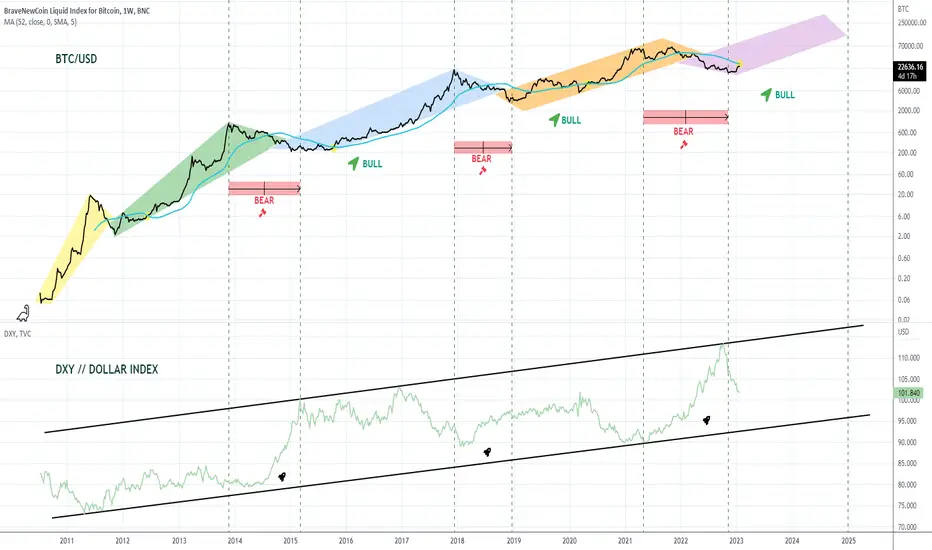
Chart timeframe is on the weekly. You can take a look at my previous weekly btc or daily chart. The info is pretty much the same, however on this chart I am zooming out even further for you. The chart on the daily for my previous chart is wrong though, I did not use the full data given to me with that chart. On this BLX chart I have the full data. On the daily I had the bottom marked around 20k and weekly I have it marked around 12k. Regardless of where I have the bottom marked, I will claim both of those charts to be off since I do not have the full data. On this chart I have data going back to 2010 giving me a more accurate wave count. Wave 1-5 on the smaller cycle took us about 11 years. I am expecting wave 3 to go a bit longer, about 12 years. Currently we've finished wave 2 or we're finishing it. Either the bottom is in at -77% or we have one last leg down to 12k, being -81%. Wave 3 price target is 180k (no moonshot).
A long position from today's price your R/R ratio: 12.52
Possible upside: 636%
Possible downside: -50%
A long position from 12k your R/R ratio: 120.33
Possible upside: 1241%
Possible downside: -10% I'd like to say none, we might wick a bit lower, but personally I would claim this to be the bottom and not use any stop losses.
I will dive a bit deeper into this chart below so I don't make this chart too sloppy.
BLX trade ideas

AW - Will The Real Bitcoin Pattern Please Stand Up...As I continue to delve deeper into each and every chart that is of importance to my followers...
Thanks to the increasing number of followers, I have decided to up my game in order to bring you the best interpretation of Bitcoin in existence.
I always think about what the real pattern is and what it means for the future.
Every step of the way it becomes clearer and clearer that what we are seeing is the beginning of biggest moves in history from this space.
AriasWave wants to be there every step of the way as we head into this new future using the best methodology every created.
Some extras not mentioned in the video:
-Green Wave 1 is a Weak 5-Wave move which means that it cannot be Wave 5 in this type of structure.
-Wave (C) within Wave D of Blue Wave 2 is weaker than Wave (A) therefore cannot be considered some sort of Wave 3.
-All things considered; this particular view indicates that Alt-Coins (That survive) will easily make insane gains along with Bitcoin.
-This also leads me wonder about what kind of interesting things are yet to come during the rest of this bear market.
Remember to use Disciplined Money Management Principles to ensure longevity as a trader.
If you don't know the long term pattern shouldn't you be doing your research instead of just following the crowd?
Just remember: I am not a financial adviser; I suggest using this only as a guide. Always do your own research.
***AriasWave is not the same as Elliott Wave so your counts may differ to mine if you happen to use it.***

Bitcoin and the SQuare RooT (SQRT) Function: Facts, DeductionsAs my title indicates, this plot highlights facts above all:
- Bitcoin price follows "Square Root" channels (SQRT function)
- All with an alternation of local Dips (each time higher than the previous ones) and new All Time High (ATH)
- These cycle Dip always materialize by an RSI 14 under a value of 34, showing an oversold (see my analysis of 2018-12-18 in link below)
- These ATH always materialize by an RSI 14 exceeding a value of 84, showing an overbought
- There is a clear correspondence with the Halvings dividing the block rewards by two for the miners, which is a programming of the progressive scarcity of generation of BTC.
So much for the facts.
Now here are my deductions:
- I have extended the layout of the SQRT channels to 2023: we are seeing a tightening of the price there, but beware, we are on a logarithmic scale! All the same, there emerges a new ATH > $ 60,000 followed by a potential local Dip which would remain higher than the current price.
- An average of the timing differences observed between the different Dip cycles allows me to consider the point of fall for a next Dip within 20 bars.
- This analysis is a little more pessimistic than my previous ones, while noting that it would still not be possible to buy 4-digit BTC (under $ 10,000) from 2022. So those who buy BTC currently will necessarily be winners on HODL.
DISCLAIMER: This is not investment advice. Invest only what you can afford to lose.
Do not listen to any "prophet" or other "evangelist", it is important that you make up your own mind.

BITCOIN BULL RUN NOT OVER YETthrought market manipulation knowledge i expect this even the if we are on bear market, but i dont think this bull market is over yet.
pay attention to RSI and MACD manipulation and price action support and resistance.

Long Term BTC - Projection of last 2 cycles to current cycleAnalysis of 2 previous cycles to project the next cycle
This is the result of making an average of previous durations and some pricepoints
Bearmarket durations:
A/ Days under ATH
2014 = 1134 d / 2018 = 1085d
==> 2022 = (1134d + 1085d) / 2 = 1110 days
B/ Days under 0.618 Fibonacci
2014 = 1120 d / 2018 = 1043 d
==> 2022 = (1120d + 1043d) / 2 = 1082 days
Conclussion = It could take until November 2024 before we see an new ATH
Also note that’s there is almost no differance between days under ATH and days under 0.618 Fib
So there is a great possibility that we don’t see price above 45k until we’re going for an new ATH
Bullmarket durations:
A/ Days above previous ATH until new ATH
2014 = 343d / 2018 = 350d
==> 2022 = (336d + 357d) / 2 = 347d
B/ Days above Macro bottom before the halving
2014 = 546d / 2018 = 504d
==> 2022 = (546d + 504d) / 2 = 525d
Conclussion = if you want pumpy action bull run you are going to need patience until the end of 2024, only after breaking 0.618 and ATH you have about a year to distribute your coins before entering a new bear market
Accumulation Range durations:
A/ Bearmarket 2014
01/2015 – 10/2015: 294 days of sideways action
Price range of 50% ranging between 210 and 315
11/2015 – 04/2015: 203 days of sideways action
Price range of 50% ranging between 315 and 480
B/ Bearmarket 2018
11/2018 – 03/2019: 133 days of sideways action
Price range of 30% ranging between 3200 and 4200
05/2019 – 02/2020: 280 days of sideways action
Price range of 60% ranging between 7000 and 11500
Conclussion =
Average days of price ranging between an 50% range =
(294d + 203d + 133d + 280d) / 4 = 230 days
C/ Bearmarket 2022
This could mean an range until this summer between 16k and 24k for the first range.
Then te second range could range between 24k and 36k wich is also 50%
FINAL CONCLUSSION:
- No ATH and break above 0.618 Fib before the end 2024
- We could have 2 periods of 230 days ranging between an range of 50%
Possible Range 1: 16k - 24k / Range 2: 24k - 36k
- Market is going to be boring for another year and a half in contrast with the bull pumps that comes when you make an new ath

AW Stellar Lumens Analysis - Q&A I Suppose...In this video I respond to some comments.
I apologize for the brief description but that is really what its all about.

Coin PerformanceComparing the performance of coins since the bottom in november-december. Observing to see what to get in later on.


Never crossed.. would it happen now?Hi All,
throughout the relatively "short" life of #BItcoin, the 50WMA and 200WMA never "death crossed".
These 2 averages coming near each other market the "global bottom".
With this logic, should we expect a big green candle shooting above the 50WMA to start pulling these 2 averages apart?
What do you think?
Thnx
Jad.

Bitcoin - Hashribbon - bottom signalWe check $BTC's price history and just do what it tells us to do!


Inverted HS Forming on Bitcoin?Just a quick thought here - this would fake out the bulls and the bears for a little while, and would correspond with DXY moving up very soon from the re-test of the channel it broke out of (area around 99-104 LFTs, 101-103 HTFs).
Failure or success of the HSi would hinge on DXY movement as well:
See related DXY ideas below.
Not marking this as long or short, just want to see if the pattern plays out and then fails and moves down or succeeds and moves up to either set of targets on the chart.

Bull run every 3.5 years?In today's review, I want to delve into the psychology of the market and examine some patterns that can be observed in the behavior of Bitcoin.
One important aspect to consider is the cyclical nature of the asset, where every 3.5 years, Bitcoin goes through a complete cycle of accumulation, growth, and subsequent decline. This does not necessarily mean that the market will move in this exact pattern for the next 3.5 years, but it is a pattern that can be observed. This illustrates how the market, the crowd, and the psychology of traders operate. By understanding that the market has these three distinct phases, we can make predictions about what to expect in the next phase. Currently, the accumulation phase is clearly visible, so I expect a growth phase to be on the horizon. However, it is difficult to predict exactly when this growth phase will begin, so I will be closely monitoring market trends and community activity to gain a better understanding.
Another tool that I often use for analyzing the market is the Chaikin Money Flow (CMF) indicator. This indicator is particularly useful when used on large timeframes. It is often used in conjunction with the accumulation/distribution indicator, but in this case, I do not need to use it because I am focusing on larger timeframes. The CMF indicator fluctuates around zero, and the basic signals are based on the sign of the indicator value: a positive value is a buy signal, and a negative value is a sell signal. Currently, the indicator is leaving the negative zone, which also indicates the formation of a bullish trend.
To summarize, I expect that a bullish trend will start in the near future. However, I cannot exclude the possibility of a fall to 18,000 before this growth phase begins. I will be closely monitoring market trends and analyzing community interest and activity to gain a better understanding of the current market conditions.

Bitcoin - TRIX indicator❌with new bullish momentumBitcoin
After a momentum drift on the TRIX indicator❌sponsored by FTX misery we see a clear momentum increase🔵🚨
A very bullish sign for BTC IMO dear Crypto Nation😉
Let me know your thoughts in the comments🤗
⬇️⬇️⬇️
Likes and Follow for updates appreciated🤗
Disclaimer:
Not financial advice
Do your own research before investing
The content shared is for educational purposes only and is my personal opinion

Sweep last weeks low, start building towards 25k+ and beyondSweep last weeks low, start building towards 25k+ and beyond for 2023
last weeks low at around 20.4k
moon 2024-25-26

Long Term Bitcoin analysisBitcoin seems to be in a large range. The fibonnaci levels are a bit unusual, going only from half to half, but the price levels seems to be respected.
Horizontal Range explanation
1. With yellow we have the main levels which mark the top and the bottom of the range
2. With White we have the levels in between for more confluence.
3. With red we have the levels to where we had the deviations from both range high and range low and also the middle of the range.
Vertical dates
1. With yellow we have the previous halving and the next aproximate halving date.
2. With red we have the first top, measured from the halving and the second top, measured from the first top.
3. With green we have the date when was the optimal time to switch to altcoins, after that aprox. 84 days of altcoin season occured.
Past overview/Future expectations
1. The current rally can go to test the middle of the range and after that if it retraces to the bottom of the range, that is where the entry zone for bitcoin is for the next bullmarket.
2. It can be observed, circled in blue, how much time Bitcoin has lasted in the upper range (from 0.5 to 1). We have aprox. 490 days from the time that it has entered until the breakdown to the lower range happend.
3. A similar movement is expected to play out with a similar date range. After the middle range is broken to the upside, we can expect a reaccumulation phase going into the halving.
4. After the halving, the bullmarket begins and we look for the 1.5 extension as the exit from BTC (In confluence to a high RSI, somwhere in the 90 value) into the altcoin market. 84 days are, again, at least expected for the altcoins to give better returns than Bitcoin as the cycle comes to an end.
5. The second top is an option that cannot be excluded here, but we will need to see how the market behave after the first top.

BTC/usdt long term chart 4BTC/usdt long term chart 4
btc usd 1 month
ultimate oscillator
lmacd
rsi
2008-2023

BTC/usdt long term chart and dxyBTC/usdt long term chart and dxy
dollar index
52weeks MA
bitcoin vs dollar
bitcoin

BTC Pi Cycle Bullrun SignalHello friends
Today im going to show you a good reason for next Bullrun in Bitcoin.
Pi cycle includes 2 Moving Average:
One Long MA and One Short MA.
when we devide this 2 MA the result equals PI number (around 3.15)
The best Long MA is 471 DAY and the best Short MA is 150 DAY.
I illustrate them in BLX chart and yo see the last 2 times that Pi cycle Bottom works properly.
the first Bottom was on JAN 2015 and second Bottom was on JAN 2019 and NOW on JAN 2023 (as i show them with Red Circles in my chart)
the indicator signal a Potential Bottom for BTC.
If Short MA (RED) surpass Long MA(GREEN) we call it a PARABOLA and the Bottom confirmed.
If you think more about that you understand this cycle happened every 4 years actually on January.
2015 - 2019 and NOW 2023.
So i explained Technical and Time Cycle Analysis for this Strong Indicator.
Hope it predict Bottoms WELL.
Be Profitable
Thank You for reading my Idea
Share me your Opinion.
Do you think BTC make a bottom NOW?

BTC - When will the manipulation/Correction end???Santiment shared a chart that shows that systematic purchases of the flagship cryptocurrency over the past two months took place right before the BTC price advanced from under the $17,000 level, assuming that these purchases made a great contribution to these price surges.
Sharks buying Bitcoin (wallets holding from 10 to 100 BTC) prevented its fall below the $16,700 level. In the past 10 weeks, per Santiment, owners of these wallets grabbed a whopping 105,600 Bitcoin.
Then small whales (wallets holding from 100 to 1,000 BTC) made their purchases, adding 67,000 Bitcoin over the past eight weeks. This fueled Bitcoin's rebound to the $18,000 level, Santiment believes.
Finally, large whales stepped in (they own between 1,000 and 10,000 BTC) as they acquired 37,100 BTC over the last 10 days. The chart shows that this purchase pushed Bitcoin over the $21,000 level briefly.
So this tells me one thing, this is definitely a correction regardless if its manipulation, the only question is, will this correction adhere to fibonacci's laws?
There is no way that we could have reached these levels with retail and the fear that surrounds Crypto with the LUNA and FTX debacle, most people were moving all their coins to cold wallets and the same people are now thinking we have found our bottom and moving up? A lot of trust needs to be gained and this takes time approx 6 months, the last move down on btc saw massive volume push that down and that normally indicates a third wave. This wave up saw the same volume that we saw in 2021 bull run with 3 tril in crypto, we currently have less that 1 bil, that should make you ask questions and logic needs to prevail at this point. Can the whales push this up further......of course and thats why i initially posed the question whether or not this move will adhere to market phycology and fibonacci laws.
I have used the point of control in order to asses the resistance and support in both my scenarios, in the short term, in the next few hours i see another push up due to volume, 23218 zone as volume and rsi has lost steam, then a correction down to either 19258 point of control or it will break down further to 14580 forming D in the falling channel. If it bounces off the point of control then it will move up and form what i believe will be 4th 29769 point of control and final correction meaning it will then move down to 11k mark creating the bottom and finally move into our much anticipated bull run of 3 years and enter the third wave of bitcoins life hitting between 100k-120k before our next correction.
Hope you enjoyed the read. One thing that i have learned more in trading than anything else is use stop losses when trading.
Till the next one

The Ultimate Bitcoin Market Cycle Cheat SheetIn this post, I'll be providing an explanation on market cycles referring to specific time periods and fibonacci support and resistance for key lows and highs.
This post is not financial advice. This is for educational and entertainment purposes only.
This post was inspired by @CryptoCon_ on twitter.
Time Periods Explained
- The chart may appear extremely messy, but let's break everything down one by one.
- I first marked all November 28ths of every year on the chart, starting from 2012.
- We can divide each cycle into a span of four years:
- The first cycle lasting from Nov. 2012 to Nov. 2016,
- The second cycle lasting from Nov. 2016 to Nov. 2020,
- The third cycle lasting from Nov. 2020 to Nov. 2024,
- and the fourth cycle beginning in Nov. 2024, ending in Nov. 2028.
Again, keep in mind that this is an extremely speculative approach, based on the premise that what happened in the past, will continue to happen in the future in a similar manner.
We can divide each of the cycles into 4 different phases.
Phase 1: New All Time Highs
- The first phase is the phase of a new all time high.
- At the end of the first phase, Bitcoin marks its new all time highs.
- Such was the case in 2013, 2017, 2021, and I expect it to be the case in 2025 as well.
Phase 2: Bear Market
- The second phase is the bear market phase.
- After we see new all time highs, we start to see a decline.
- In 2014, Bitcoin corrected 78% from its all time highs,
- 85% from its all time highs in 2018, and 75% in 2022.
Phase 3: Accumulation
- This is a phase of accumulation.
- However, this is not to say that we will only see sideways action.
- From 2014 to 2015, we saw a classic price action of accumulation,
- and from 2018 to 2019, we saw a textbook accumulation pattern, followed by an echo bubble.
- However, it is imiportant to note that this echo bubble (or more specifically, its burst) is what set up the foundation for a massive bull rally that led to new all time highs.
- According to this cycle, we are currently seeing Phase 3, where I expect a similar echo bubble to take place. I’ll elaborate more on the current status later.
Phase 4: Recovery
- This is the phase of recovery. This is where we know that the price has bottomed out already, and that we set off to rally towards new all time highs.
- Interestingly enough, all Bitcoin halving events took place in the 4th phase of this cycle classification.
Estimates for Cycle 4
- For the current cycle (cycle 4), I believe that the echo bubble thesis is in play.
- The Fed cannot taper forever, and there is still enough liquidity to be injected into risky assets.
- Despite Bitcoin moving from $16k to $23k in a matter of days, the interest from the general public is nonexistent.
- I believe that a move to 30k is highly likely, and that depending on market situations, we may even see a move up to $45k in the end.
Comparison of Past Echo Bubble
- Let’s compare the current situation to that of the echo bubble in 2018-2019.
- In 2018-2019, we saw Bitcoin rally 268% in an echo bubble. A move from $16k to $45k, today’s echo bubble, would account for a 211% move.
- As for the degree of correction, in 2018-2019, we saw the price slash in half once again - a 56% downward move.
- Taking that into account, and applying the same figure in today’s market situation, that would mean a correction from $45k to $23k.
- If we trace fibonaccin lines based on this speculation, this gives us a target price of $105k per Bitcoin by 2025.
- As for the bear market that will follow, we can expect a bottom to form around $36k, although it’s likely that prices will almost definitely hover below this level.
Statistics
- Let’s take a look at some patterns we can spot in terms of statistics:
- In the first cycle, Bitcoin dropped 77.99% from its all time highs
- In the second cycle, Bitcoin dropped 83.64% from its all time highs
- In the third cycle, Bitcoin dropped 76.64% from tis all time highs
- Assuming that Bitcoin drops 75-85% during the bear market after peaking at new all time highs, anticipating a 65% drop in 2026-2027 would be a conservative, yet realistic estimate.
- As for the returns Bitcoin provided every cycle;
- In the first cycle, Bitcoin delivered 43,236% returns from the lows to highs.
- In the second cycle, it delivered 9,134%, which is a 78% reduced figure compared to the previous cycle.
- In the third cycle, it delievered 2,102%, a 77% reduced figure compared to the previous cycle.
- In the fourth cycle, the current cycle, if it reaches $105k all time highs, it would be delivering a 524% return from its lows, which is a 75% reduced figure compared to the third cycle.
Conclusion
In this post, I take a very rudimentary, speculative, yet simple and direct approach in analyzing Bitcoin’s cycle through this specific framework. This analysis aims to provide a general understanding of when things happen, and to what degree they take place. Based on this framework, I believe that we could see an echo bubble take place in 2023, with Bitcoin reaching $45k, before it corrects down to $23k. Around the end of 2023 to 2024, we would see a phase of recovery in which Bitcoin slowly crawls back up, until it reaches new all time highs of $105k in 2025 before correcting down below $36k in 2027.
If you like this educational post, please make sure to like, and follow for more quality content!
If you have any questions or comments, feel free to comment below! :)

$360K BTC in 2023 if we are in a similar type of rally like 2017The title says enough. We might be in a similar type of rally like we had in 2017, which means that you won't be getting any chances to buy lower after corrections. 12 Jan 2023 is when BTC began pumping, just like in 2017, I have used the bars pattern from that period, that pump lasted until a blow off top in Dec.
