Bitcoin Monthly Trendline - Something to check back onThis is s roughly drawn trendline which I am posting purely to refer back to and see if it continues to provide a base/bottom area for bitcoin in the coming years.
BLX trade ideas

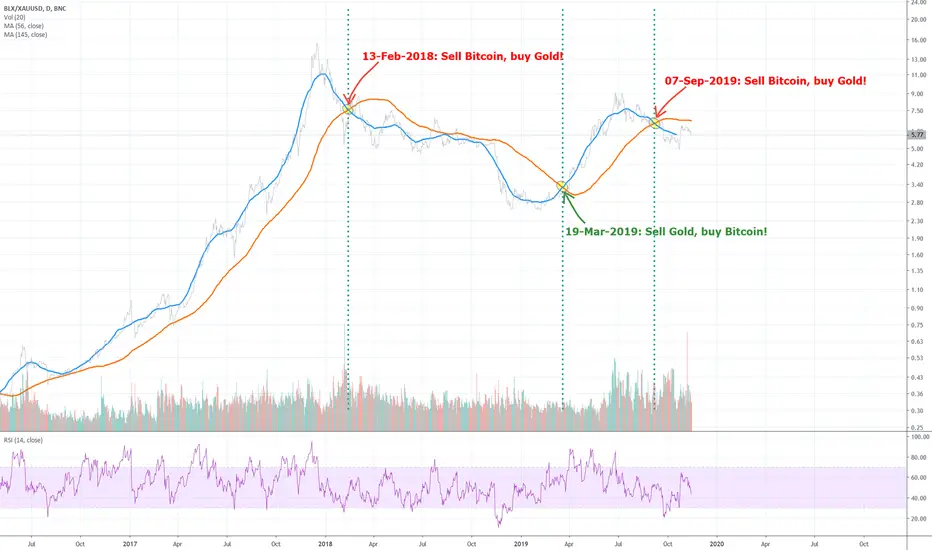
BTC : When can you be profitable with Bitcoin again?When can you be profitable with Bitcoin again?
I'll tell you what, without many words, just look at the chart.
It gives simple signals when to act. 2-3 trades per year, that's all you need. Calm sleep, nice life.
When will the next time come when you should buy Bitcoin again? The answer is up there on the chart.
This simple but mega-powerful idea was presented to you by ReallyMe. Don't forget where you read it first. Take care & good luck.
Bitcoin TA 2022 - Yearly Candle Pattern-LifeCycle Of Bitcoin.Hello everyone, hope you all are doing good.
As I saw many people focusing on Yearly Candle patterns of Bitcoin, so I thought to make a Bitcoin Analysis and Observe it in a bigger perspective.
This Bitcoin Analysis is not a financial advice, cryptocurrency market is highly volatile and highly risky, so please do research before trading.
It's a New Year season, so I Wish everyone a Happy new year-2023 to you all.
Please don't feel bad about me on my current Bitcoin Analysis, since chart speaks everything, am sorry to say but Bitcoin looks bad as of now, the trend is breaking down,
If the current year candle-2022 closes above 29k than we are safe and can expect the continuation of trend in upside direction.
No means it's a point of concern for every one of us.
I also explained everything in the chart, please check it in detail.
Thank you,
and please like and share my idea/comment if you have any questions.

Dollar Index vs Bitcoin.Dollar Index ( #DXY ) vs #BTC . Is it true that "DXY up, BTC down. BTC up, DXY down"?.
1. According to the data, when DXY ( orange line) breaks out and starts to go up, BTC will begin to enter its bear market. But if you look carefully, there is something interesting.
2. After DXY undergoes its uptrend for a while, it starts to lose its momentum and enters a sideway mode. This is where BTC has bottomed out and start to make some uptrend/rebound move.
2.1 After sideways, and DXY starts to become bearish and that is when BTC does a parabolic move up.
**3. The interesting part in these cycles is that during the sideway movement of DXY , when DXY goes up, it does not mean that BTC will go down. It could be clearly seen that BTC can also go up when DXY goes up.
Summary
1. Is it true that "DXY up, BTC down. BTC up, DXY down"?
Yes, "but" that is not always the case.
2. So when does BTC move in the same direction as DXY?
When DXY loses its uptrend momentum.
3.When does BTC going parabolic again?
When DXY enters downtrend.


Bitcoin TA from 2010 to 2022 - According to Elliott Wave theory.Bitcoin in Dec-2017 made its ATH 19k~ and for the first time Bitcoin has entered in the same zone.
If we look back from 2010 to now-2022, since it entered in a zone of previous ATH never before,
so if we apply Elliott Wave theory to Bitcoin, the current capitulation looks like ABC correction in a larger time frame.
(The time frame of this ABC correction is just my thoughts, may prolong or may shorten).
since there is no negligible rsi formed, so ignored the first bitcoin cycle.
Right now, we are at the end of (12345)-of-wave-A of total ABC correction
I made two probabilities, it's just my personal thoughts not financial advice.
1.based on Elliott Wave theory.
2.based on Momentum/Trend based (looking back past history and predict future). For time being am publishing 1, the 2nd one i will publish later.
a) 12345 of wave-A of total ABC correction- Bitcoin may end up the wave-A at roughly 13700 or 11500.
( i took based on the volume and the downward trend line)
b) abc of wave-B of total ABC correction - Bitcoin may end up the wave-B at max 50k.
(i took this number where bitcoin can go maximum up).
c) 12345 of wave-C of total ABC correction- Bitcoin may end up the wave-C may be from 4000 to 5000.
(i took this number based on maximum volume traded and generally according to Elliott Wave theory, after a 5 wave impulse is done, ABC correction usually end up in the area of wave 4 low.)

History & Halving of Bitcoin from 2009 to 2022● October 31, 2008, Nakamoto Satoshi, known as the developer of Bitcoin, published a paper called Bitcoin: P2P Electronic Money System on the Internet.
● January 3, 2009, the first open-source Bitcoin client was created. Satoshi Nakamoto obtained 50 BTC through the first mining. This is commonly referred to as the Genesis Block
● May 22, 2010, Rogramer Laszlo Hanyetz delivered two pizzas of Papa Jones and paid for them in 10,000 bitcoins
● August 22, 2010, Bitcoin's first and last technical error occurred
● April 18, 2011, Namecoin, the world's first altcoin, appeared.
● September 27, 2012, the Bitcoin Foundation was formed.
● December 6, 2012, the first Bitcoin exchange in Europe obtained a banking license.
● October 29, 2013, the first Bitcoin ATM was installed in Vancouver, Canada.
● Vitalik Buterin Ethereum was first founded in 2014
● February 26, 2014, Mount Gox (www.mtgox.com), the second largest Bitcoin exchange, was closed.
● January 6, 2015, Europe's third-largest bitstamp on the Bitcoin exchange revealed that its wallet had been stolen through hacking.
● December 2017, $19764 achieves a new reporting point
● In November 2018, a bill banning Chinese cryptocurrency mining and exchanges was issued
● It has been about 487 days since February 21, 2018, when $11,000 was reached on June 22, 2019.
● Bitcoin was designated as the world's first legal currency in El Salvador on June 9, 2021.
● April 14, 2021 achieved the highest point in Bitcoin history of 68944$
● February 24, 2022: Ukraine's Russian War breaks out
● May 2022 Luna and FTX incident occurred

In A Parallel Universe Without Corona ...in a parallel universe without corona, we maybe would have reached the predicted top and bottom. in a hypothetical self-contained plane of existence, bullrun would start in april 2023.

$BTC | Risk MetricI have tried to fit a curved line along as many bottom wicks as I could. I then copied this line and tried to fit it across the tops, then plotted two more instances at the 25%, and 75% of said range. The white boxes represent one year from Jan - Jan.


Bitcoin Back to $70k SoonStock market and Bitcoin forming descending broadening wedge, Bitcoin is also forming a falling wedge, both patterns have a target back to ATH's. 2023 should be an interesting year!

Bitcoin in a Falling Wedge?Falling wedges can break either direction & are notorious both for faking out market participants AND for the speed at which the ultimate move goes. Should this pattern fill out a bit more so that it's crystal clear that it's a FW, here are the break out targets visualized.
For breaks to the upside:
~$30,000 (macro resistance)
~$25,000 (highest high in the pattern)
For breaks to the downside:
~$9,750 (1.618 extension of move)
~$5,250 (measured move)
Armed with these targets, you should be able to begin formulating a plan.
Again, markets tend to move VERY quickly once a breakout occurs. I often liken it so someone yelling FIRE in a crowded theater & everyone rushing for the exits at once. Those sidelined & off sides will react swiftly to close their positions (both manually or with stops). Margin cascades will occur fast and fierce.
As is often the case during bear markets, LIMIT YOUR MARGIN USAGE!


Bitcoin Technical Analysis 2022 - Based on OnBalanceVolumeHello every one, hope you all are doing good.
This is not a financial Advice, crypto is very volatile and risky, so please do research by your own before doing trade.
OBV OnBalanceVolume is one of important indicator to find the volume locations/movement of volume and the movement of the price.
sometimes it's hard to find out the Divergences using RSI alone, stochastic oscillator and MFI is also one good indicator to identify the Divergences.
Apart from RSI, MFI and stochastic, we can find divergence using OBV too.
For example, as I mentioned in the chart, the Orange Box (from Jan 2015 to April 2016) the price action of Bitcoin was roughly from 200usd to 500usd
but the OBV value is showing a huge "Divergences" roughly from just 3M to 23M perhaps the all-time high of OBV is 37M.
So, most of the critical volume is inside this orange zone, so throughout the life cycle of Bitcoin this volume is playing a vital role until now.
According to Wyckoff theory the market movers or market makers or so-called Composite Men (Orange Box) who buy cheaply and sell at high.
Ok, let's come to point, this time am making this Bitcoin Analysis based on OBV to find the critical zones of volume and where we are at now throughout the Bitcoin Life Cycle.
After deeply analyzing the OBV and drawing the trendlines and channels where the volume and price is respecting more, after the massive Breakout from the parallel channel (at orange zone),
Orange zone is the actual/core accumulation zone of overall Bitcoin where the Composite Men accumulated buying very cheaply and keep Distributing till now and Distribute until the Bitcoin is reset.
Final Conclusion1:
After the massive Breakout from the Parallel channel, the Momentum of OBV is not drastically increasing but instead its Dropping steadily.
From 2016-Breakout to until now 2022 the OBV value is ranging between roughly 25M to 38M (not huge difference), the momentum of going up is Dropped and
Instead of Breakout from the channel it Brokedown in the current Bear Market 2022 this is something concerned of.
So most likely the OBV will keep testing and testing the top of the channel and to my guess it keeps failing and failing same as the blue ascending triangle in the chart
and don't know when but, at some point of time at least once, it should test the bottom of the parallel channel. (May be this test will be the Reset point for Bitcoin).
Final Conclusion2:
Currently there is a slight Divergence created in OBV as price falling and OBV is showing small uptrend.
So most likely soon there will be a counter move in the upside direction and test the upper line of the parallel channel.
(In most cases this kind of slight Divergences happens in corrective waves when the market is selling off (during Distribution phase) and forcibly divert the market to move in reverse direction).
Please give a like and comment if you have any questions.
Thank you.

Historic moment for Bitcoin - Winter is comingAs we can see, in 3-5 weeks from now i.e, 3rd week for Jan to 2nd week of Feb 2023, we are looking at 50 week and 200 week moving average death cross. This has NEVER happened in the history of bitcoin. As of now, it doesn't look like market will go above 24K to avoid this death cross. Hence, the possibility of a never seen before crypto winter.
Moreover, you can see from the Fib extension that the target levels are ~13363 (fib 0.382), ~9734 (fib 0.5) or as low as ~6100 (fib 0.618). To draw this fib levels I assumed that the bear market began from the top of March-April 2022.
Additionally, In previous bear market of 2018 Bitcoin dropped ~83%. In the bear market of 2014, it dropped ~83%. In the bear market of 2011 it dropped ~92%. Therefore, a drop of ~85% from ATH would mean price would reach ~9800, which is close to 0.5 fib level and a drop of 91% would make the price as low as ~6000.
A drop to 6K seems difficult to imagine for myself but drops like this has happened in the past and BTC will recover stronger than ever. What do you guys think?
I'm learning myself and feedbacks are welcome.
PS: This is not a financial advice but just a point of view.

Bitcoin likely botttoms b4 $8200. Bottom being formed right nowThis is a spot idea for those debating whether now is a good time to begin acquiring the stash for the next cycle. Bitcoin is bottoming as we speak pending recession risk there is strong support at $8200 in a worst-case outcome. However, there are strong technical indications pointing to more upside. The first real upside targets in the long term are $45,000+ for BTC in the next 360-527 days which represents a modest 127%+ return from current levels. In light of recent events like the FTX implosion, it is safe to say that US regulators will come hard on other "alternative currencies" whether they will make it through another cycle is up in the air. However, for now, bitcoin has been a deemed commodity by the SEC and represents the most prudent investment to make in light of current events. Now is the time to build a core position for the next run-up.

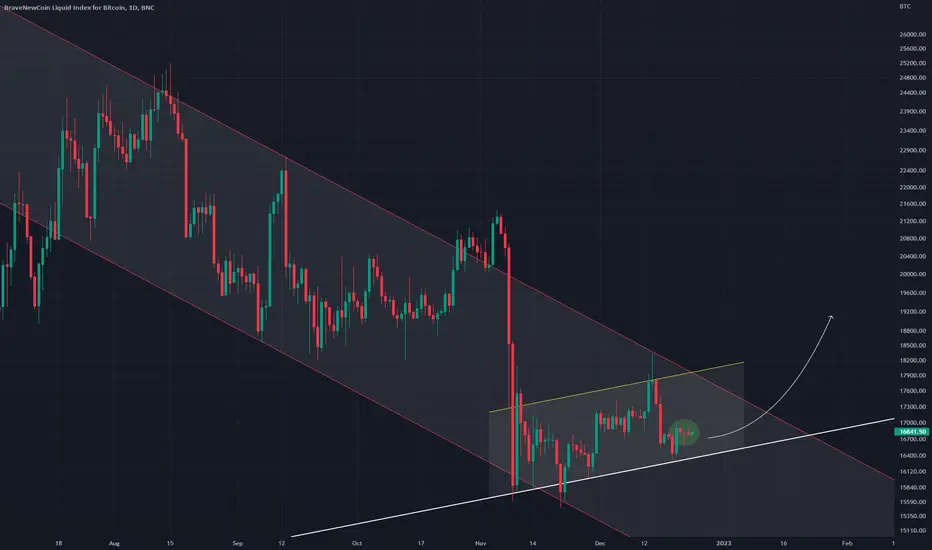
Bitcoin Reversal Hopes BLX trend line in solid white that needs to hodl for price to reverse to the upside
If this structure breaks down and it is no longer a higher low price may continue downward within the channel
Hopes
Long btcLooking at the up and down the limits of price action in the past we can create boundaries and forecast the momentum of future moves.

Strong support for bitcoinAttention! Incredibly long text!
A huge cluster of pending orders to buy Bitcoin will not allow the price to drop to the $13,000 area expected by everyone.
In addition, these conditions will allow the market maker to move the market to the $32,000-$38,000 region in order to use a trap for marginal bears and their subsequent liquidation.

Bitcoin is ready for a rallyThe ratio of itcoin to the money supply index is at its bottom. This is a good place to start a new path.

Analysis of long-term trend of Bitcoin through annual chartLooking at Bitcoin on an annual chart, we see it finishing above its 5-year moving average.
If Bitcoin's year-over-year trend is to be alive
The 5-year moving average should be maintained within this year.
In other words, I have to go 20k within this year.

Bitcoin TA from 2010 to 2022 - Based on previous Patterns/cyclesAs I said I will post an idea different from Elliott wave theory. Not a financial Advice, this is my personal opinion or idea.
This Bitcoin Technical Analysis is purely based on studying its own previous trends/cycles and predicting the future cycle.
This is not based on Elliotte wave Theory nor am comparing it with DXY or S&P or Dow, next time I will make an idea based on correlation with DXY/Dollar.
Before proceeding I will tell an interesting story " The Story of Zombie and chickens".
A lazy zombie maintains the chicken farm, since chickens grow and breed faster so the numbers are keep growing n growing.
Throughout the year zombie keeps eating chickens and he keeps growing bigger n bigger. Since the zombie is very lazy, he needs help and maintains a dog to look after all the chickens.
As per now for every 4 years or so zombie gets seasonal disease and to get recover himself, he eats chickens in a massive number, not all though.
Dog also keeps eating for his survival, but after all its dog, so when the dog gets older and unable to handle the chickens, zombie appoints a new young dog to take his place.
The conclusion of this story is "Zombie never dies and keeps growing n growing, chickens are born kill and the dog keeps replaced by a new dog".
Ok let's proceed with our Analysis. Different traders visualize the charts in different ways based on their own perception. Chart is the emotions of all traders, it's like map of treasures.
I see many people use trend lines, Fibonacci, moving averages, Ichimoko or other technical indicators and many other.
Even I use many of these, but for this am not using averages or Fibonacci or Ichimoko. Am using RSI and money flow index indicators and triangle pattern for this.
1.Explaining the Patterns or drawings which I created:
Chart patterns in longer time frames, price moves in waves or some kind of curves rather than straight lines/trendlines.
I made some concentric circles where the price is respecting more (basically support n resistances), that doesn't mean the price goes in a circular fashion and goes back to its origin - zero.
Always trend breaks (upside or downside) so may be at some point of time it may break out this circular channel and form a new trend of circles.
I created the triangle pattern in this way --> (A)previous ATH-> to ->(B)current ATH-> to ->(C)lowest bearish Point-> to -> Highest counter move).
For each Bull of Bitcoin (with in 2yrs or so), it is forming a kind of symmetrical triangle with ABCD waves inside it.
(Symmetrical Triangle pattern --> Breaking out of the pattern --> new Bull or new Triangle pattern again).
2.Observation and conclusion taken from the patterns:
After deeply observing the previous 3 symmetrical triangles of Bitcoin-Green, Blue and Purple. I was wandering how to make the current pattern.
The information I have is (previous ATH 20k (point A) + current ATH 70k (point B) + I took 15500(point C) as temporary Bottom.
The conclusion is Green + Blue + Purple triangles are symmetrical in shape. (Symmetrical triangles are mostly bullish and breakout upside not compulsory though).
But for the current cycle, bitcoin is making is Descending triangle. Descending triangle patterns are generally bullish as well as bearish depend on where they are created.
(At the Bottom OR At top of the cycle). As of now it is at the top (so this means there are chances it may breakdown from this Descending triangle).
What I observed is cycle after cycle the width of the triangles are increasing and the height is getting decreased, technically what does this mean?
what I concluded is the move of going sideways is increasing and the momentum or motive of going up is diminishing/normalizing.
(So, this means there are high chances Bitcoin may move less upside and may go sideways or down).
One more thing I observed is after massive move/action of correction of every cycle (Bitcoin Bottom) there is counter move/reaction (Point D of the Triangle).
Generally, the point "D" of every cycle is laying above the top edge of previous symmetrical triangle (the sky-blue horizontal arrow lines).
(So based on the above observation I took the "D" point at 50k as counter move/reaction for current cycle/Descending triangle,
also, it is coinciding with the concentric circles which I made).
3.Final Conclusion, studying the current Descending triangle (Red)/Probabilities:
After over all study, this is my Personal Opinion:
1.Current correction is so massive with in short period of time, considering previous counter rallies and currently bullish Divergences formed in RSI + MFI taking into account,
so high possibilities that there can be a counter rally up to 50k or more than that.
2.I don't think current low 15495 is Bottom for Bitcoin. May be temporary Bottom or it may go little lower than now creating 2 layers of bullish divergences in RSI (for temp Bottom).
(Technically current pattern is Descending triangle, so high possibilities that Bitcoin may make lower low (another low may be 13780) after the counter rally.
to my guess Bitcoin may put its lower low after the Halving).
4.Probabilities of next Bull/cycle:
case1: After Bitcoin making lower low (may be 13.7k), this is the situation DO/DIE for Bitcoin.
If Bitcoin manages to break out of this Descending triangle similar to previous moves, it can put a new ATH (for another decade Bitcoin may trade between 19k to 160k).
case2: Since current pattern is Descending triangle, if Bitcoin fails to breakout from this channel, there are high probabilities that it will break down.
If Bitcoin Breaks Down, most likely it will reset itself from over all cycle right from 2010. (This scenario can be same as my previous Elliott wave theory which I already shared.)
Am sorry my Technical Analysis looks little complex; I hope I explained well.
Thank you.

BTCUSD - RSI RecoveryRecurring RSI pattern that shows a higher low double bottom pattern
This is shown in white rectangles
A strong reversal sign
