ATOM Bollinger BandThis is Bollinger band indicator. Default value is set at length 20 with 1 Standard Deviation (Narrow)
Light blue region indicate votality of price movement between Upper and Lower Band
Line chart is represent price movement. Decision to buy/sell is as following :-
1 - Potential Buy - Price Line turned Green crossed above upper Band.
2 - Potential Sell - Price Line turned Red crossed below lower Band.
Note :- Price breakout from narrow band normally result in rally.
The longer duration of narrow band will result in stronger rally after breakout
Best use with "EMA Indicators with BUY sell Signal"
A1MT34 trade ideas

EMA Trend with Turtle Buy/Sell SignalCombine 3 EMA Indicators with BUY/SELL Signal based on Turtle Indicator
1 - Combine EMA20 (Thin red line), EMA50 (Green thicker line) and EMA200 (Thickest Purple lines)
2 - Buy signal based on default 20 Days Highest High resistance
3 - Sell signal based on default 10 Days Lowest Low support
Input
- Short EMA (20), Mid EMA (50) and Long EMA (200)
- Resistance (20) = 20 Days Highest High line
- Support (10) = 10 Days Lowest Low line

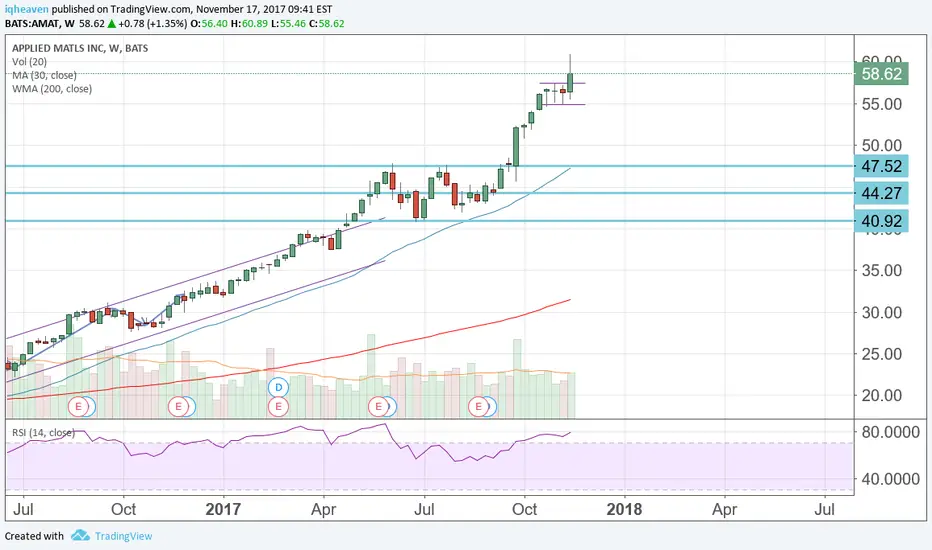
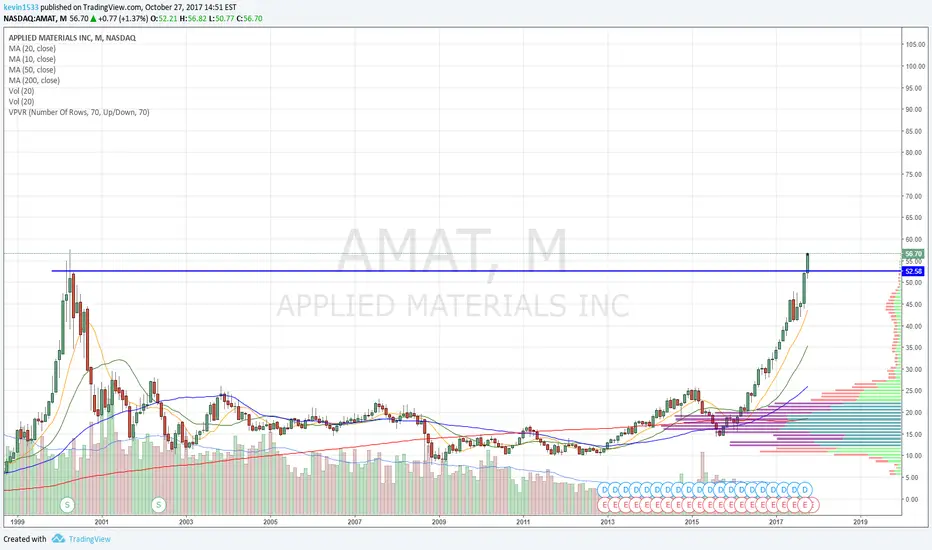
AMAT, another cup just formedThis lagger finally playing catch up
Since the dotcom bubble collapse, AMAT has been consolidating as a rounding bottom cup for 17 good years into uncharted territory!


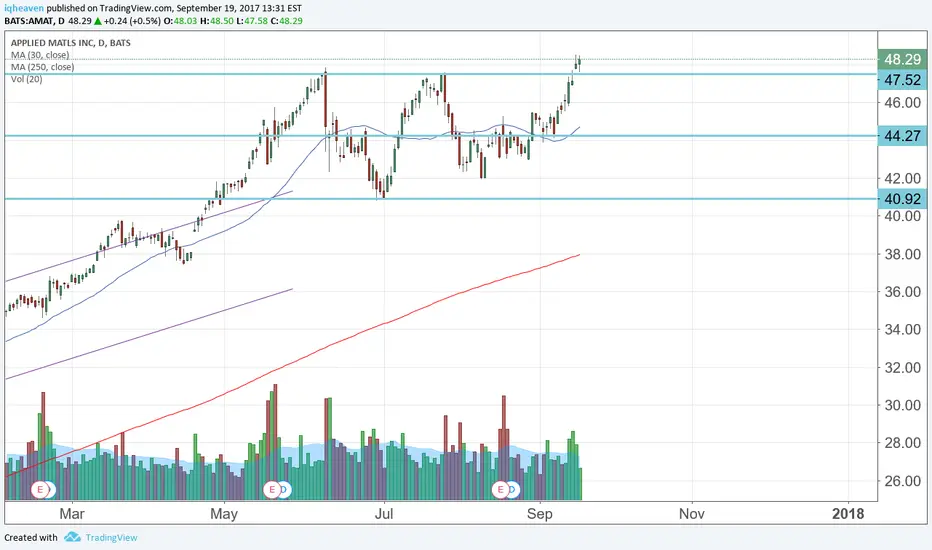
Earnings breakout pullback to previous resistance turned supportEntry 57.24, Stop 56.19, Target 61.44 $AMAT $SOXX $SOXL

Force Index HistogramThe Force Index (By Alexander Elder)is a price-and-volume oscillator that helps technical analysts determines if a stock's trend is strengthening or weakening. It is calculated based on the raw Force Index (difference between today's close and yesterday's close times today's volume) and smoothing it with an exponential moving average.
Signals
If the Force index is above zero (GREEN) it signals that the bulls are in control. Negative (RED) Force index signals that the bears are in control. If the bar near zero index or whipsaws around zero, it signals that neither side has control and no strong trend exists.
Go long if the Force index is GREEN and there is a bullish divergence.
Go short if the Force index is RED and there is a bearish divergence.

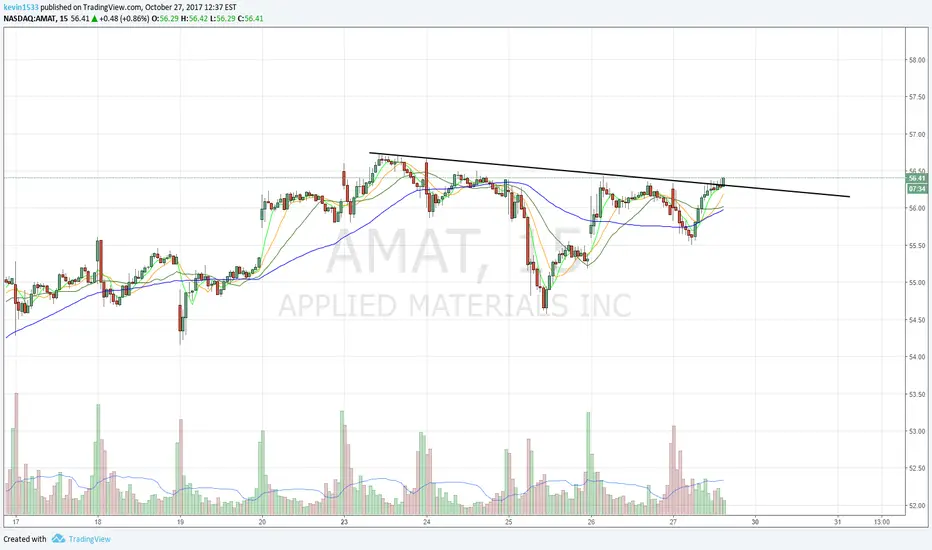
AMAT - Waiting for next breakout around 57.39Get ready for AMAT to break out from 57.39 level.
Trend shows that price rally right after breakout with improved Force Index (Red to Green) and Price cross above upper bollinger band.


Time To "Short" APPLIED MATERIALS Is Coming Closer & Closer.Applied Materials Ins (NASDAQ: AMAT) is giving signs for Loss Of Buyer's Momentum at the top as per TTC Breakdown Formation . The 54.50 Zone is very critical for now to hold the breakdown. If price manages to sustain below this Critical TTC Zone , we can see buyers losing control to the sellers in the markets.
For Short-term targets, Trader should eye on 53.20 Zone . Then 52.20 is the next support. For Swing Traders, 48.50 zone is Very Critical. Below which we can see a good amount of selling.
Applied Materials, Inc. provides manufacturing equipment, services, and software to the semiconductor, display, and related industries worldwide. It operates through three segments: Semiconductor Systems, Applied Global Services, and Display and Adjacent Markets.

$AMAT - Applied Materials - BuyEntry order for AMAT at $44.
We've seen two dojo bars hold the 100ma with a break higher today.
The volume isn't as high as I would like to see, however, the financials look strong and in my opinion the semi conductor industry will only continue to grow.
Sl 40
Tp 50

APPLIED MATERIALS Long ... Secondary breakout!!!After the anti-climax of the false-breakout / bull-trap, we get to have a second go at this. Target still the same, but stops tightened to below yesterday's low.
Here we go again!
#AMAT #Semiconductor #SOX


AMAT breakoutAMAT is a good watch here. If it is anything like how it broke out last time (highlighted circle), it will take a few days of small moves before it gets going so might need some patience here and try to buy off dips with risk off of the $47 level.

APPLIED MATERIALS Long... one for the stock watchersAMAT, the world's largest semiconductor equipment manufacturer, poised for a breakout from a clearly defined right-angled triangle.
Excellent risk to reward trade.
With semiconductor sales on fire, AMAT essentially builds the engines that drive the industry.


AMAT Twin Peaks with a Deep ValleyTwin Peaks and Deep Valley usually indicate a potential change in the current trend. If AMAT were to break the black uptrend line as well as the lowest point of the Deep Valley, we would expect the initial drop to fill the April 2017 common gap around $38. Further weakness could push the stock price down to $33.
Short Entry: $44.38
Stop Loss: $46
Initial Target: $38
Risk:Reward - 1:5
Secondary Target: $33
Risk:Reward - 1:8
If you like my analysis, please click like and follow me.

Breakout Setup -3 Pending signals-General Market up +1% today. MU going to ATHs. And these guys are shaping up to a nicely define breakout on the RSI and MACD.
Confidence level on this one is 7/10. I will reflect on this idea once things have played out.
Apologies for the brief description.
Please like if you agree with the idea.
Please comment if you have any thoughts.
Thank you.
