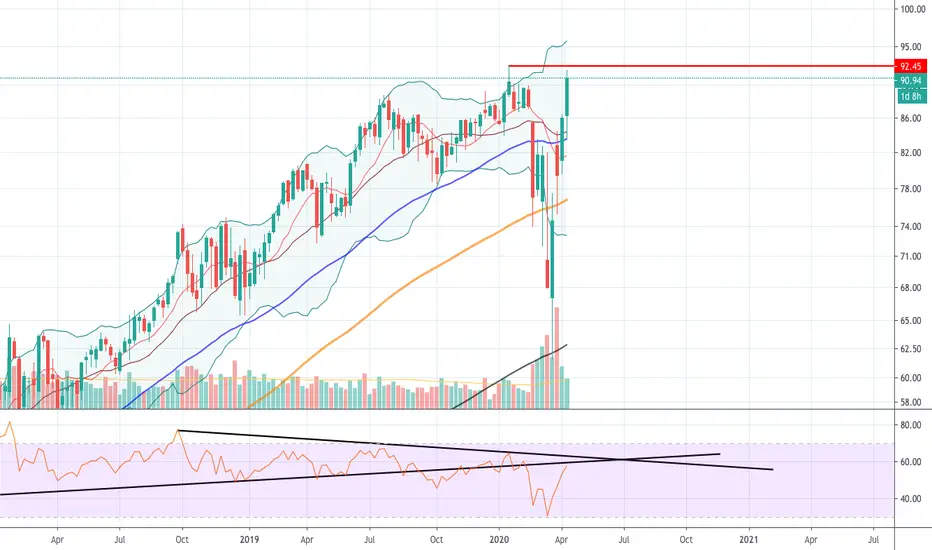
Bullish Breakout of Lightning CloudThe stock has formed an inverted head and shoulder pattern in Apr, 2020 and turned the outlook to positive. The prices are supported by a bullish trendline, which also confirms a positive trend. In addition, the stock has broken above the upper boundary of a bullish flag pattern and has just broken above the lightning cloud with a larger white candle. The 50-day (blue line) moving average is turning up and is likely to cross above the 250-day (red line) one in sight. The daily RSI is supported by a bullish trendline and is heading upwards above its neutrality level at 50%. The MACD is above the 0-level and is turning up, while the MACD histogram is narrowing.
In sum, the technical picture of the stock is positive. Above lighting cloud, the stock is likely to further upside and challenge the next resistance at $100 again. A break above this level would call for a further advance towards $103 (127.2% fib. Extension between point A and B).
ABTT34 trade ideas

ABT hit the supportABT hit the support and now is going straight up. It is expected to go all the way up to $100.06 the resistnace.

ABT - Price Pattern Analysis/Falling WedgeBelow is a detailed chart of some of my favorite trading techniques and how they apply to day trading - more specifically here is the falling wedge. This is one of my favorites to trade - especially after an uptrend like in ABT, as they are heavily biased towards bullish breakouts. These offer great potential from a risk-reward point of view - limited downside but high potential. Highly recommend adding this tool to your arsenal if you aren't already familiar!


Abbott Laboratories (ABT - US) Buy for 5th wave upAbbott Laboratories (ABT - US) looks like 4th wave completed on trend channel. It’s out-performing the market. Buy with stops below 92.75 for target of above 100. Volume supported by earning date.


Possible bullish continuation flag to the all time highHere we see a downward flag ( bullish flag ) that formed from the uptrend after it reached the all time high. This could mean a possible uptrend continuation after the break of the flag going up.
We see some support below between 93 and 92, but it could possibly break that as well and change directions, but nothing is written in stone. We also have the COVID-19 going on, so that is something major that could cause it to change trends and continue down. We need to wait a few more days to see what it will do. We also have the COVID-19 going on, and that is something major that could cause it to change trends and continue down.

ABBOTT LABORATORIESthe price makes a pull back on the yellow trend line.
if the price strongly breaks the yellow trend line and the small white rectangle, next target the red rectangle ($85.50)
if the price does not break the yellow trend line, next target $95 provided the price breaks the white horizontal line forcefully ($91.73)
don't forget to subscribe to receive updates if you find interesting what I do

Abbott Laboratories [ NYSE: ABT ]Abbott Laboratories
Pending Order Placement
Entry Placement 95.90
Take Profit Placement 106.62
Stop Loss Placement 88.75

ABBOTT LABS BREAKOUT TARGET $100
Big day for ABT tomorrow as earnings are announced,
Company has been extremely active in COVID-19 testing and carries a lot of expectation.
MACD & Histogram very Bullish
RSI has room to run higher


potential Bearish GartleyIt seems that a potential Bearish Gartley is forming that aims to be completed at 86 to 87.


Abbott Labs has $100 in its sights
Game changer technology in COPVID-19 testing - results now within minutes rather than hours.
Will look to fibonacci levels as targets if resistance breaks

$ABT Heads into Coronavirus Testing Pole PositionABT shares are ripping higher in recent action as the company achieves the vanguard in COVID-19 testing with its 5-minute results method -- which looks likely to set the new standard and redefine how we track this tragic disease.
This comes off a massively oversold low, and now we are back in the prior long-term range with supports in place.

Abbott Labs Game changer $abt
High volume today but advance was held at strong resistance.
possible entry on the break above this level or trade up to that level once again
.
Gap down would be nice to fill the gap

ABT analysisGood setup here. Needs to break $80.65 with a 1 hr Green candle. Will see $85 if it breaks $80.65

$ABT can fall todayLow volatility stock intraday trading strategy signal.
$ABT chart shows appropriate parameters to open position. Also, the true range is low enough today, so the price has good potential to fall.
I suppose, the price will be falling until market close, so short sell can be from $80,22;
stop loss — $81;
take-profit — $77,88 or market close price.
Do not view this idea as a recommendation for trading or investing. It is published only to introduce my own vision.
Always do your own analysis before making deals. When you use any materials, do not rely on blind trust.
You should remember that isolated deals do not give systematic profit, so trade/invest using a developed strategy.
If you like my content, you can subscribe to the news and receive my fresh ideas.
Thanks for being with me!
