Amgen Announces Positive Top-Line Results From Otezla® (apremilaAMGN: Amgen Inc.
2021-12-01 16:00:00
Amgen Announces Positive Top-Line Results From Otezla® (apremilast) Phase 3 DISCREET Study In Moderate To Severe Genital Psoriasis
AMGN34 trade ideas

Buy $AMGN - NRPicks 10 SetAmgen Inc. discovers, develops, manufactures and delivers human therapeutics worldwide. It focuses on the areas of inflammation, oncology/hematology, bone health, cardiovascular disease, nephrology and neuroscience. It has agreements with Novartis Pharma; Bayer HealthCar and Eli Lilly.
Revenue TTM 25.4B
Net Income TTM 5.7B
EBITDA TTM 12.43B
Net Margin TTM 22.5%
Dividend yield 3.27%.

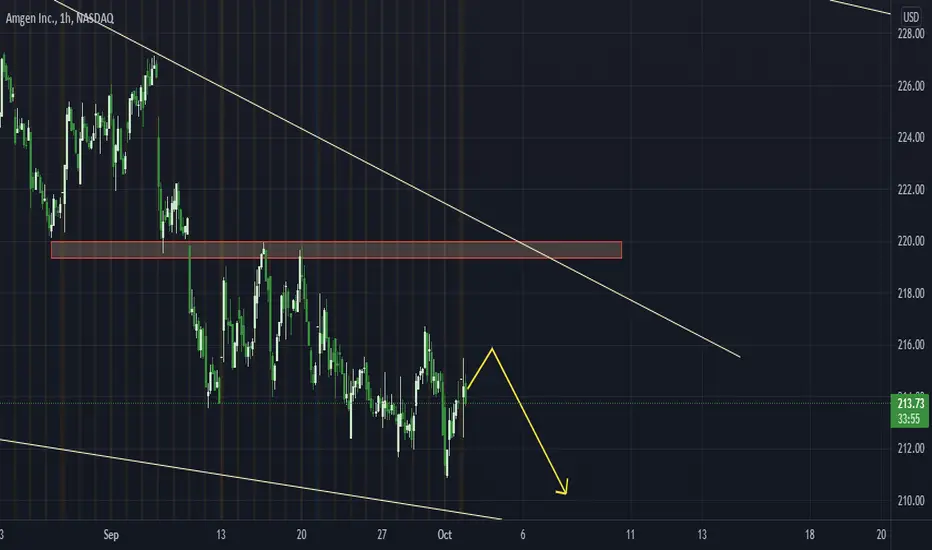
AMGN with nice setupHi Traders,
AMGN fell after Q2 Earnings back in August and entered a downtrend down to ~200 USD. With this, it entered a strong area of support (ATH of 2018, low of Oct. 2020).
AMGN then broke downward trend but then get capped by resistance at 210 USD and retestet downward trendline from above.
By the end of October just before earnings it started to move up with significant increase in volume. This weeks retest of supportlevel at 210 USD was perfectly in line with fib levels.
So by now the short term trend tends to be upwards, we have retestet trendline and support level and earnings behind us. Maybe ex-date can ruin this setup, but to be safe, an entry could also be done after passing last high at 219.26 USD. SL slighty under supportlevel of 210 USD.
First target is trendline and maybe ATH.
Cheers

Technical analysis (AMGN)Amgen, Inc. (AMGN)
Limit buy - 213,0$
Target - 243,05
Risk/Reward Ratio - 3,34
Stop-loss - 204,0
The price has approached a good level, we enter the position.

AMGEN who knows what they do, but it has to do with moneyInteresting compare to the crash off in money supply velocity to Amgen’s delayed bull run
Maybe something to do with their business model.
Also compares to money supply and seems to correlate with increase in money supply dollars finding their new homes as we can see as the money supply velocity drops off drastically.

AMGEN INC : CMP 206 AMGEN INC in Weekly Timeframe Correction from November 2019 l....this correction expected to end in 6 month....only buy after breakout which is above 230 on a weekly Closing basis....after Breakout Stock expected to run for target 400-485

AMGN: Short term sellAll trade in sell order/buy order, might not trigger, cancel if the price has run too far.
FDA Approves Repatha® (evolocumab) In Pediatric Patients Age 10 AMGN: Amgen
2021-09-25 20:00:00
FDA Approves Repatha® (evolocumab) In Pediatric Patients Age 10 And Older With Heterozygous Familial Hypercholesterolemia

GANN Theory Finally Completed StrategyI took a couple of months off to read a book i found on Amazon on Andrew Gann the inventor of GANN theory. After finishing his article i theorized that it could be transformed in these modern times. This will a Membership to perform, Alerts mean allot to people that want to automate the thought process behind this. Please note that i am not a paid person posting this, i been trading for 16 years ever since i graduated from High School, I went to college to understand Pattern Recognition. Believe it or not there is a pattern to every aspect of our Lives.
I have the MTF Support and Resistance from Annan Set to Daily .
Poor Mans Volume Profile ___ this is critical for plotting the GANN BOX onto the Charts with little to no thought process.
To plot the GANN BOX (not the GANN fix Box or the GANN angles) You are taking the Gann Box Placing it on the Poor Mans Volume Profile DAILY chart. For an Uptrend you go UP 2 and right 2 , you'll understand when you plot it. For Down Trend down 2 right 2 . Sideways (rangebound) oddly special one. Up 1 Right 2 Down 1 Right 2 . When your plotting on the charts LOCK the Gann on the chart. I use Daily Right 2 because i set it at the beginning of the MONTH and its good for until the NEXT month. you set alerts on the GANN FIB LINES. (ENTRYS) BASED... If you are having issues with plotting this LET ME KNOW... its gets very automated when you plotting it. The Poor Mans Volume Profile takes the calculations out of the picture.
Posting a picture of the Points your going up or down 2.
How you Plot it on the Poor Mans Volume Profile. last step is to LOCK it on the Daily CHART.
Alerts need to the be set on the 2 of the Gann Lines. ( set to Crossing ) Subscription premium allow you to set an unexpired alert. If you want to Swing with this strategy. You have to do something different by Anchoring on the Weekly and trading on the 30 min or 1hr you can swing with this. But as yourself are you going to swing or are you going to Day-trade this.
Stop loss is a very touchie subject that everyone should think about doing... Personally i use 4 different methods Count 5 bars back, last Swing point, or Halfway between the two fibs of entry. if i am feeling lucky just on the other side of the Fib Entry point. * the Lucky part of this one is if it goes bad you have a very LOW LOW risk of loosing allot of hard earned capital. Generally I will use the 5 bars back method.
CM- Slingshot set to Conservative.
Next 2 will be the Exits on the Trades and Indicators to take the Trade.
DYNAMIC RSI - DRSI for short just tweak the color on this one, from DreadBlitz. ____
MTF RSI from Chris Moody 14 70 30 D D 30 ___ set a color where you can see the MidPoint.
NOTE: When Entering you are looking at the Chart___ when it crosses the GANN FIB line. after the Bar completes, look at the DRSI and MTF RSI midpoint cross. (after the Cross has Happen and you can Confirm it on both u can now Enter the Trade.)
The exit point is when the DRSI goes Solid Filled color, secondly this effect will be happening on the MTF RSI.
I take all of my trades on the 15min timeframe with an Anchor on the Daily Chart. Anchor meaning MTF MTF MTF MTF all of them are set to the daily. I want to make thoughtful readings based on the Daily Overall proceedings of the market direction.

Amgen: Short term up5th wave finished right at the major support, hoping for a jump if the support still valid. Previous batch of trades has closed except AMZN still running. (BABA-0.6%, UPS-1%, V-2%, AXP+1.5%, MAR+1.5%, SBUX+3%, WFC+0%)

AMGN LONG POSITIONNASDAQ:AMGN
On a weekly timeframe chart, we can see that the candlesticks made a channel which have support line near 215 and the resistance near 260. We tasting support there.

AMGNAMGN - shares haven't had a weekly close below $216 in over a year. This is a key level, needs to hold. Weekly RSI is around 38.2. Shares bounced off this RSI level several times in the past.

Amgen Inc. (AMGN)Interesting graphical retracement for the Amgen stock which sees a considerable decline from the highs of the year. Where does the caution stem from? First, management highlighted that new patient prescriptions remain below pre-COVID-19 levels, and second, variants are suggesting demand may be muted for now. The stock has a solid capital appreciation potential and dividend growth prospects out to 2024-2026.
Annual Profit: 9.5 bil $
Total debt: 32.7 bil $


$AMGN may bounce from hereFormed nice base at this level. Good opportunity to accumulate for long term.

Amgn on SupportAmgn has bounced from this level 3 times before. Daily Macd is about to turn. RSI is indicating Oversold. Might go 230+

Amgen (AMGN) Swing- Solid company
- Has had downward trend for weeks but is now at support
- For the six months ended 30 June 2021, Amgen, Inc. revenues increased less than 1% to $12.43B.
- Net income decreased 42% to $2.11B. Revenues reflect Prolia segment increase of 20% to $1.57B
- Other revenues segment increase of 28% to $721M, also reflect Enbrel segment decrease of14% to $2.07B, Neulasta segment decrease of 19% to $968M.
- Net income was partially offset by Research and development increase of 7% to $2.05B (expense), Selling.

$AMGN with a Neutral outlook following its earnings #Stocks The PEAD projected a Neutral outlook for $AMGN after a Negative Under reaction following its earnings release placing the stock in drift D with an expected accuracy of 71%.
If you would like to see the Drift for another stock please message us. Also click on the Like Button if this was useful and follow us or join us.

Bias: UpOverall in a triangle formation. Expecting a break of the triangle in future. Potential buy trade. Make sure to apply SL & TP.

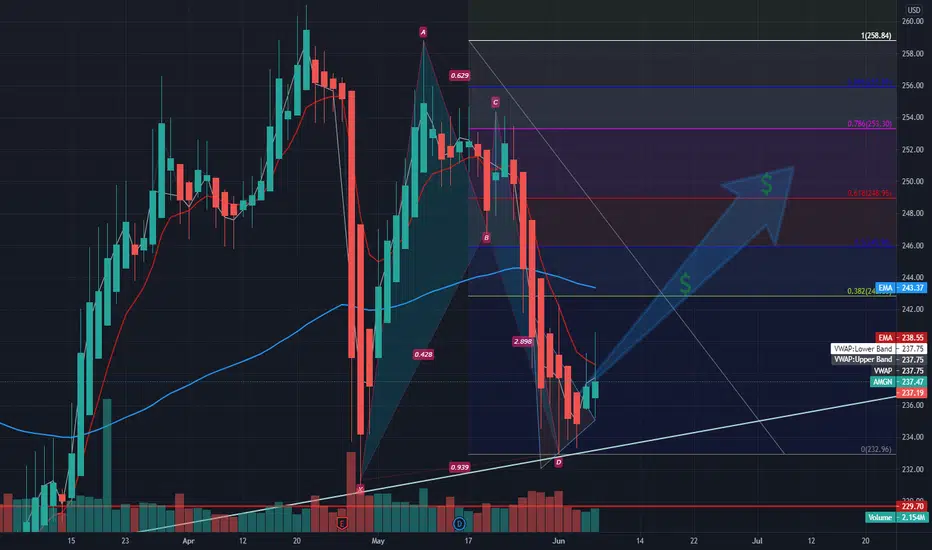
Buy on Break-Out - AMGN [S] 1 June 2021AMGN
Relative Volume: 1.23
Fib Extension 0.618: Swing price target 251.75
Annual Performance: 4.86%
Monthly Performance: 4.8%
Trend
Monthly: Uptrend
Weekly: Side
Daily: Uptrend
EMA: Potentially bullish on breakout
Slow Stochastics: Golden Crossover
RSI: Overbought zone
Put/Call Ratio: 0.292
Wait for breakout during final trading hour
TF1D Break-out at 241
TF1H Confirmation: Green Volume

Symmetrical TrianglePattern is neutral until a trendline has been broken.
No recommendation.
This does not appear to be a tight triangle, yet.
