BABA34 trade ideas

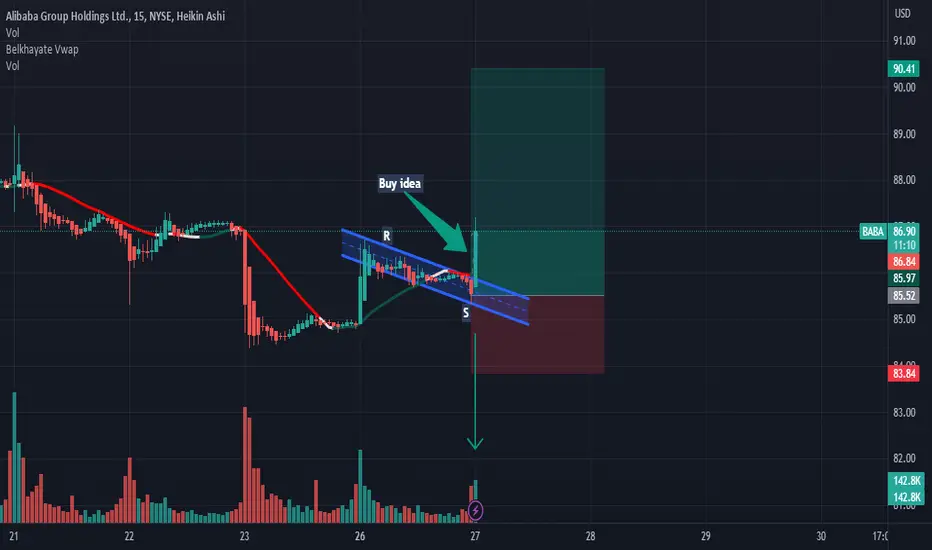
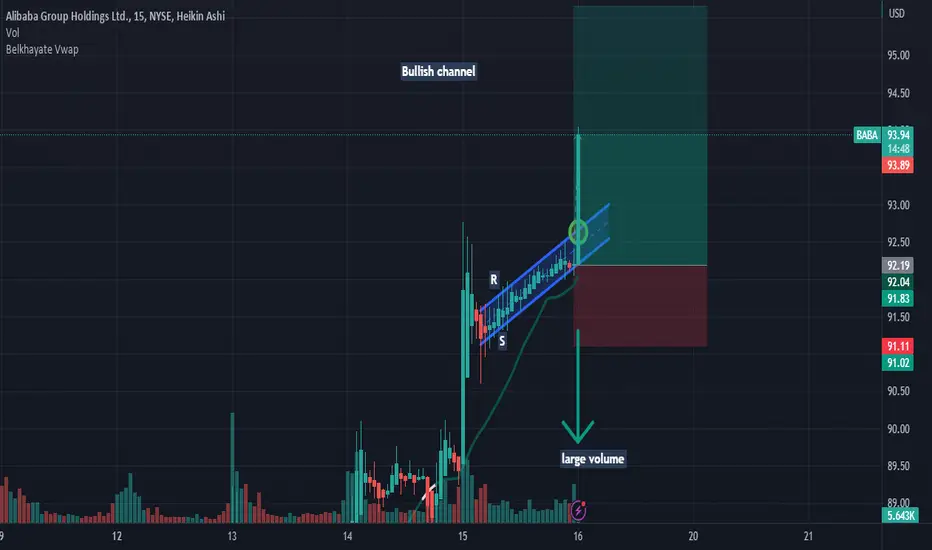
BABA: Buy ideaBuy idea on BABA as you see on the chart because we have the breakout with force the vwap and the resistance line by a big green candle with a large green volume.Thanks!
Second Post on $BABA: BULL FLAG IS CONFIRMED!!
On this $NYSE: BABA chart I drew a bull flag indicating a short-term price increase. I estimate the maximum target price to be around $141 per share. I calculated this by overlaying the length of the "flagpole" or the original bullish period onto the breakout point.
Also on this chart is a bullish hammer candlestick next to the green flag. This is when the open and close prices are close together and the wick of the candlestick is long. Ergo is another indication of positive price action.
I speculate that investors are anticipating the EPS estimate increase to 1.96 in August 2023 from the reported 1.56 in May 2023, causing the price to increase.
Finally, the MACD, or moving average convergence divergence is a powerful tool for determining price action. As you can see from the chart above, the blue MACD line is following the orange signal line upwards, indicating a movement upwards. This is strong evidence that a bullish reversal is about to happen.
With love,
Judah Levin

Post Dragon Boat Festival, BABA moves higher. Looking back at BABA's chart, I noticed that it has moved higher after the annual Dragon Boat Festival. Last year, the Hong Kong Market was closed for one day (Friday) making it a three-day weekend for the Chinese market. This year, it was even longer. With four days of pent-up demand at defined supply levels, I see this having an aggressive, short-term move upward.
In 2022, BABA made an approximately 30% impulse to upside resistance after the three-day weekend.
This year, after a four-day weekend, I'm projecting a 30-37% move from Monday to Wednesday.
With the restructuring of management and stimulus entering the Chinese economy. We could see aggressive upside potential from here.
This is not financial advice. Past performance does not guarantee future results.

A different way to identify momentum with MACD (BABA)Before coming up with this idea I asked myself the following question: is there a way to visualize whether sellers or buyers are in control during a certain move/period of stock price action?
In order to achieve this, I decided to connect the moves with the associated changes on the MACD histogram bars and try to plot the "area's" on the Histogram bars as a form of "accumulative momentum".
With BABA, it can be seen seen that a "change of character" has occurred since march of 2022 where for the first time the area above the 0 line between the histogram bars became larger than the area below it. Is this further evidence that the stock has been in accumulation mode ever since? Time will tell!

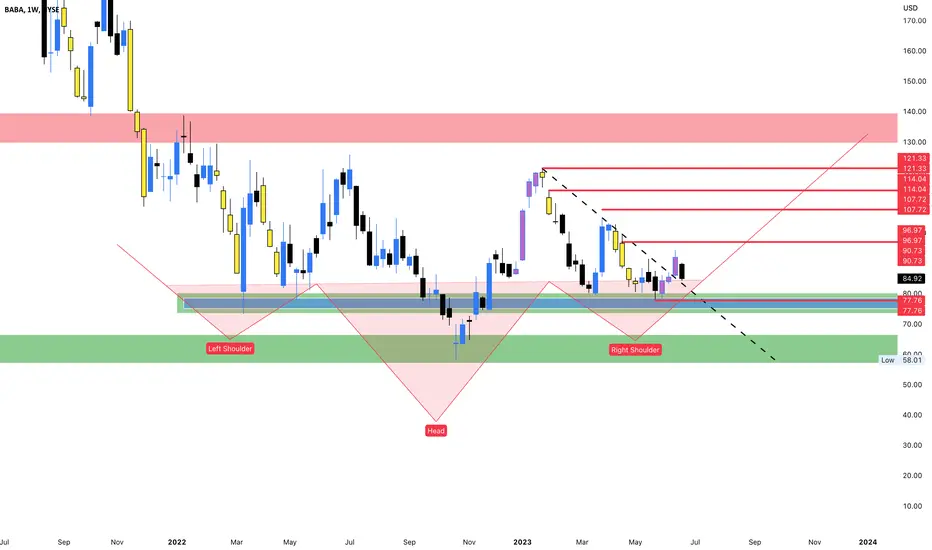
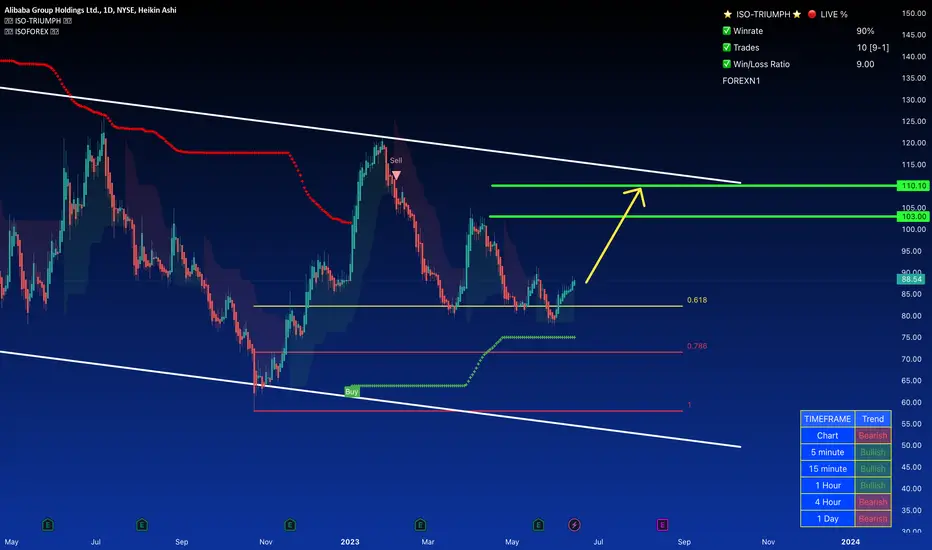
BABA LEAPS idea On the monthly and weekly charts, BABA is forming a large inverted head and shoulders pattern. It has broken a longterm down trend that began back in late January 2023. It is currently retesting the downtrend line as a support in confluence with a support level that has held price on 4 separate occasions since March 2022. It can be noted that price is also sitting at the fib golden zone on the weekly when plotting the low of the head from the H&S with the high that followed from that low. Price on the weekly is also displaying a double bottom pattern after retracing to the fib golden zone.
Trade Idea: Watch price's reaction at this level. Wait for the weekly candles to stablize and create bullish intentions by displaying candles that are making higher highs or some type of bullish pattern/confirmation. The current weekly candles are in a downtrend. Wait for the price to drop a bit more then once the price action on the weekly begins to create bullish trending candles, plan your entry for a LEAPS play dating at least a year or more out.
Targets: 96.97, 107.72, 114.04, 121.33
Stop: Break and Hold below 77.76-80.09
BABA Yearly Demand Zone Set Up Potential? Over next few months l'll be considering for bullish setup potential with PA down here in and around monthly weekly demand zones. Long term view ahead and thats only if /when sellers become exhausted enough?! , l''ll wait for price structure to tell me what it doing.. & how price builds on multiple time frames perspective while considering and understanding its price dynamics 'PRICE IS KING' then once confirmation presents itself l'll only enter then l'll target above level.
DYOR!! Yes anything can happen, standard disclaimer advice please.
Perma

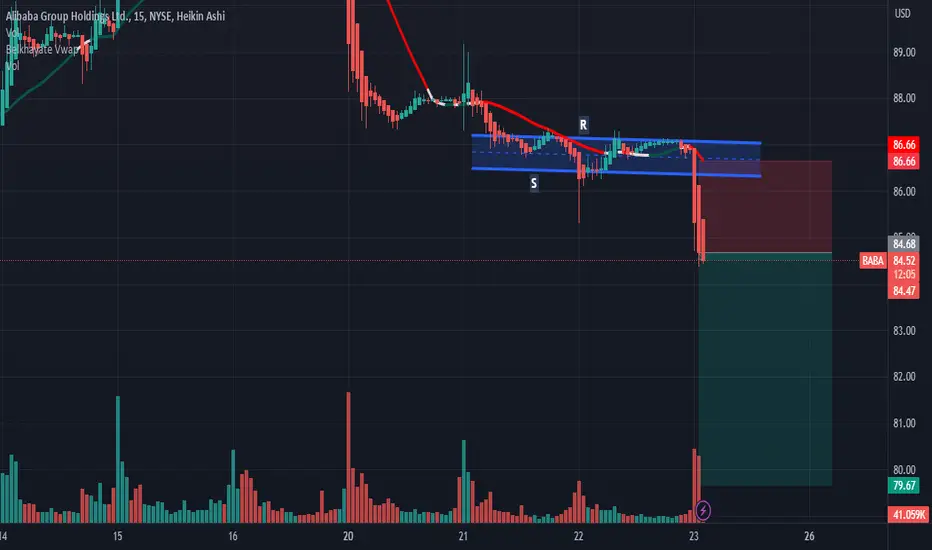
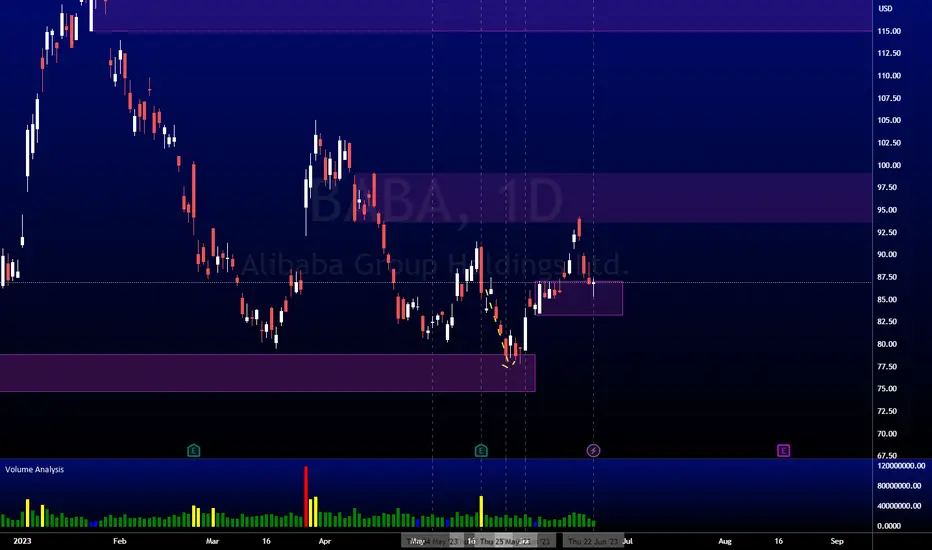
BABA: Sell ideaSell idea on BABA as you see on the chart after the breakout of vwap and support line by the sellers.Thanks!
BABA AnalysisPrice playing out nicely as my last analysis. Price mitigated the higher bearish POI at 99.17 and give a nice 9.51% retracement to the downside. Price is currently mitigating the bullish POI at 87.06 and is showing some signs of bullishness, in confluence with a low volume retracement. I'm expecting price to continue higher from here.
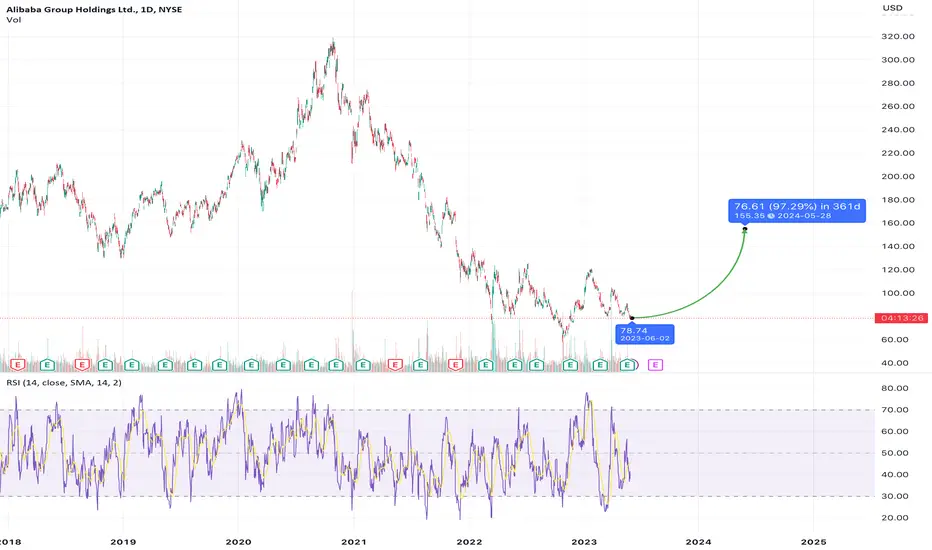
Time to enter another swing trade?Selling might bottoming out at around $83. Looking to that range to hop in.

BABA: Sell ideaSell idea on BABA as you see on the chart after the breakout with force the support line by a big red candle.Thanks!

Gimme BABASomeone else has probably published this idea. Wonderful momentum shifting inverse head and shoulders on the weekly, MONSTER weekly bullish bat harmonic price target beyond the measured move of this inverse head and shoulders at a close above 119. Hidden bullish divergence noted on RSI and MACD on this local retest low of the right shoulder. Bullish harmonic confirmation noted on proprietary HSI oscillator on the weekly. Wonderful entry area, easy SL below the head.

BABA: Buy idea: Bullish ChannelBuy idea on BABA as you see on the chart because we are above the vwap indicator and also we have the breakout with force the resistance line.Thanks!
Baba Short Technically short
Fundamentals long
I short Baba! Cuz fundamentals are manipulated, and news are made by insiders and old.
I keep it simple. But profitable and effective.


BABA buy?BABA broke out of the descending triangle. Now we look for a pullback to bounce off the 10MA. I will not buy until I have that confirmation.

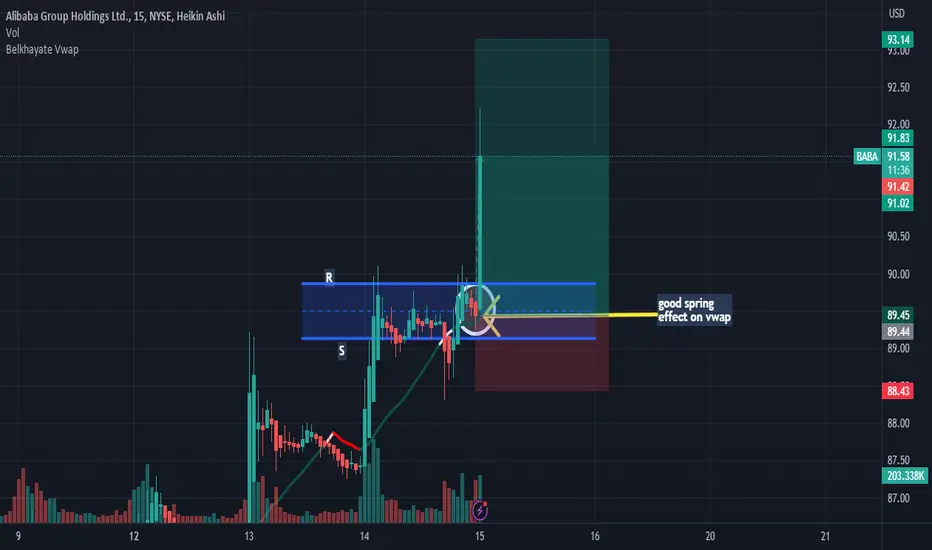
BABA: Buy ideaBuy idea on BABA as you see on the chart because we have a good spring effect on vwap and also we have the breakout with force the resistance line by a big green candle.Thanks!
Part II of BABA thesis using Wyckoff phases and volume analysisThis Idea is part II to the previously published BABA idea using Wyckoff's accumulation method. This idea includes the identification of the different Wyckoff accumulation phases and the characteristic accompanying volume analysis.
All information is on the chart!
NQdecipher

BABA with a Bullish Breakout on the Daily trendBABA has recently confirmed a bullish breakout on the daily trend, indicating a potential continuation of the upward momentum. The formation of a triple bottom pattern further reinforces the bullish outlook. As long as the support level holds, we can expect the price to rally towards the recent highs around $105. Traders should monitor the price action for further confirmation and adjust their strategies accordingly. It's important to stay informed about the latest market conditions and news related to BABA for a well-rounded analysis.

Alibaba:From Promise to Setback and The Potential for ReboundAlibaba, once considered a promising investment tied to China's growth prospects, has faced significant setbacks in the past five years. Despite its declining stock price, the company has continued to expand its business, albeit at a slower pace. However, there are reasons behind Alibaba's decline in appeal, and it's worth exploring the likelihood of a stock rebound in the coming years.
During the past five years, Alibaba achieved impressive growth in annual revenue, with a compound annual growth rate (CAGR) of 28% from fiscal 2018 to 2023. However, recent data indicates a concerning deceleration in growth over the past two years.
This slowdown can be attributed to two primary challenges. Firstly, Alibaba faced setbacks when China's antitrust regulators imposed a historic fine in 2021, leading to tighter restrictions on the e-commerce division. These restrictions weakened Alibaba's competitive position against rivals in the fiercely competitive online retail market.
Secondly, the economic slowdown during the pandemic, along with intermittent lockdowns, had a broad impact on consumer spending across Alibaba's platforms and hindered enterprise spending on its cloud infrastructure services.
To address these challenges, Alibaba made significant strategic moves to streamline its operations. The company restructured its business into six distinct groups, giving each group more autonomy to seek external funding or conduct IPOs. Alibaba plans to spin off its Cloud Intelligence group through an IPO and explore potential IPOs for its logistics and global digital commerce divisions.
These spin-off companies can generate fresh capital, improve overall margins, and expand more rapidly without being closely managed by Alibaba. If successful, they could lead to increased net profits and help alleviate concerns from antitrust regulators.
Looking ahead, the spin-offs initiated by Alibaba have the potential to attract significant investor attention. Alongside this, Alibaba's reported growth is expected to stabilize as the macroeconomic environment improves and its core markets expand. Projections show growth potential in China's e-commerce and cloud computing services markets.
Analysts forecast moderate growth for Alibaba's revenue and net income, driven by continued spin-offs and spending discipline. If Alibaba meets these expectations and maintains a modest growth rate, it could achieve substantial revenue and net income by fiscal 2028.
Considering these factors, even if Alibaba's valuations remain steady, its stock could potentially double in the next few years. However, the emergence of a new bull market and the resolution of delisting concerns could further elevate its valuations. In simple terms, Alibaba's stock could triple or exceed that growth by fiscal 2028.
BABA compresing, will ir be high or low?BABA is presenting a triangle compresing with a breakout aproaching. The direction will be related with economic and fundamental news of China, if it is up I'm waiting a break and retest, if is low I'm waiting for a violent movement.