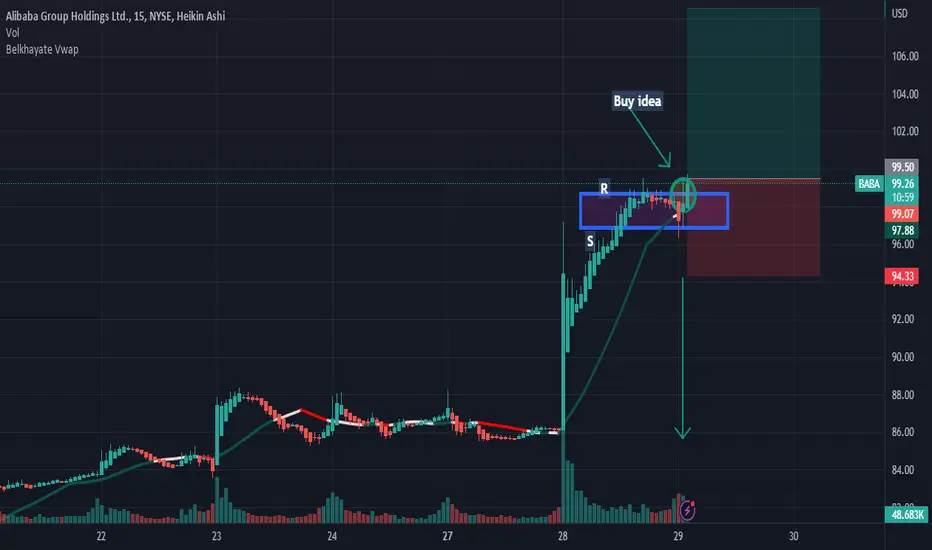
BABA: Buy ideaBuy idea on BABA as you see on the chart because we have the breakout of the resistance line.Thanks!
BABA34 trade ideas
Watchlist 2023-03-29 $SPY $LULU $BABA $VKTX $SCS $AUPHSPY - had a very tight range day but without too much volatility allowed for moves in names like BABA and VKTX. Gapping up this morning back into key resistance areas, SPY will have trouble making it through these levels without any catalysts in the near future, however, as volatility drops in the banking sector it seems fears of a widespread economic collapse have eased, which gives room for the relatively strong tech sector room to move.
Remember, for a trend day we'll need to see the $ADD pinned near +\-2000 and $VOLD ratio over +/- 3 and $TICK cumulating past 0 wicking to +/-900.
$LULU - stock soars 13% on revenue, earnings beat, and better full year guidance. Up 6 ATRs which is far too much in PM trading but with a triple beat on 2 RVOL, we are not looking to short this name. Looking for support at 360 or 350. Need to see support in the form of a double bottom or Rev h&S on the 5 min for confirmation.
$BABA - expecting a range bound day. Support is 96 and 94. same rules apply as above. Likely will need a few days of consolidation before a test of 100 again.
$VKTX - has potential to keep grinding higher as it finished at the HOD and has more room to ATHs. Looking for support tests of 14.5.
$SCS - a previous watch a few days ago. It's now broken and tested the 8.35 level looking for a break above 8.80. Will need to see vol come in on the break as PD was fairly light.
Other watches:
$STM - BO over 52.25
$AUPH - looking for support test of 10.65 or 10.40

BABA Bullish Pattern Weekly/Monthly Inverse H&S shaping up- BABA potential Weekly / monthly inverse H&S shaping up
- need to form weekly uptrends first
- 4h EMA 12 short term uptrend guide.

9988 | Alibaba - Wave Analysis | Inverted H&S TFW Target +100%Wave analysis and chart pattern projection:
> A possible valid inversed head & shoulders pattern in weekly timeframe, potentially 2-wave correction and rebound to retest the neckline resistance for a strong breakout.
> TP Inverted H&S @ 1.618 and 2.0 fibonacci +100+%
> MACD doubled bullish divergence signal golden cross above baseline indicating bullish move.

ALIBABA On the 1D MA50. Closing above = $120.Alibaba Group Holdings (BABA) hit today its 1D MA50 (blue trend-line) for the first time since February 16. In the past year, every time the price closed a 1D candle above the 1D MA50, it soared to at least 120.00 which is the bottom of the 1 Year Resistance Zone.
This time the stock is past a 1D Golden Cross pattern, the first such formation March 18 2019, which is technically bullish. What it needs to avoid is closing below its Higher Lows trend-line, which on September 16 2022 kickstarted a strong sell-off.
-------------------------------------------------------------------------------
** Please LIKE 👍, FOLLOW ✅, SHARE 🙌 and COMMENT ✍ if you enjoy this idea! Also share your ideas and charts in the comments section below! **
-------------------------------------------------------------------------------
💸💸💸💸💸💸
👇 👇 👇 👇 👇 👇

$BABA - UpdateJust picking up on a previous analysis linked to this one.
1. The long term downtrend, neatly captured by that downward sloping trend line, came to an end with that decisive, above-average sized bullish candle back in November 2022.
2. Price driven towards the proximal resistance are drawn for historical thresholds in this market.
3. Price rejected by that resistance level and driven back to the new support area with a bearish candle displaying volume divergence signals.
4. Market currently forming a hammer candle inside the value/support area ... which might as well be a trigger for a bullish trade targeting 1stly the resistance level mentioned before, and 2ndly the 50 EMA, should the price break above the upcoming obstacle.
Manage risk at all times, at all costs.
Cheers,
Ruben / Tenacious Tribe - Backtested Trading Strategies & Studies

baba broke out NYSE:BABA Broke-out of double bottom , we got retest for the neckline and now watching for upside continuation . 84.5-85 Must be held for target validation . Also if we hold the bottom and we range to 126-127 level we might get inverse head and should with target above 200 .

$BABA potential Inverse head & shoulderNot financial advice.
$BABA potential Inverse head & Shoulder.
Be cautious on this one since it already gapped up overnight so it might retest before continues to finish the right shoulder formation few gaps on the red to the upside.
please #like and #subscribe
Thanks Alex!

BabaWe’ve been talking about baba for a little while now. We finally are seeing it breakout abive an beyond my green box range. We are up at some resistance from a previous bear flag range before drop The green box has top toes tanks 90.90 and bottom of box is 88,30s. This 88$ level was big reistance we tested 3 times and failed each time. I would love to see baba come back and rest that. If it can test and hold It would be a great spot to take a long. If it doesn’t wanna come down to the 88, we could watch 91 area as well
If we come down below 86.50 , this idea of us continuing to move up, is probably a fake

BABA: Sell ideaSell idea on BABA as you see on the chart we have the breakout of the vwap and support line and also we have a squeeze.Thanks!

BABA on the move again Baba has broken the Trendline , NYSE:BABA
MACD - Making a U-Turn
RSI- Gaining strenghth
Remember, do trades within your limit. Don't leverage.
invest ONLY Max 10% of your portfolio Capital in each Trade with 3-5 trenches
Happy Trading.

Inverse Head and ShouldersFirst Objective: $120
The head and shoulders chart pattern is a popular and easy-to-spot pattern in technical analysis that shows a baseline with three peaks, the middle peak being the highest. The head and shoulders chart depicts a bullish-to-bearish trend reversal and signals that an upward trend is nearing its end.

Alibaba probably forming head & shoulder pattern. 24/March/23.Alibaba’s downward price probably stalled @ 1) Demand Zone 2) Right shoulder of reverse head & shoulder pattern.

BABA AnalysisPrice playing out nicely according to my analysis last week, retracing back to the bearish POI at 92.92, following the bearish order flow. I'm expecting price to continue lower from here, into the bullish POI at 78.85 next.

BABA is in the process of bottoming outEven though BABA stock' price ongoing bearish bias still persists, however there are some signs that the stock price is bottoming out signaling a possible bullish trend toward 125 by the end of Jun 2023 and possible move toward 245 by Mar 2024.
While supports are seen around 73.2 and 80 however downside risk which is a fall in price toward 58 cannot be ruled out at this volatile environment.
Supports=73.2 and 80 (almost 5 to 15% down from the current price)
Targets=125 , 245 (almost 45% upside from the current price)
Downside risk=58 ( [almost 30% downside from the current price)

BabaRejexted my box area of reistance. I had calls from yestedsy I closed them this morning up 500$ profit. LFG. Now baba comes back to 85-85.30 we need it to hold support there otherwise this is a bearish setup. We don’t want to see a loss of 85$ but I think it holds and we go long but we have to be patient upon the test of it short it to 85s and hold the short in case we lose that support. If we bounce and double bottom on it close it

Baba So yeateday we were discussing long on baba at 83.70. I did take this long idea and put my money where my mouth is
Now my idea was a backtest of previous hourly range reistance flipping to new support. We got that wick down 10-20 cents below my buy but premarket we are up into the previous support of the bearflag considlation before the last drop. So my first reistance unfortunately is far above my entry. Howver I will wait to see how price reacts. The key reistance of yes stay was very clear 85.30 was rejected twice x
Even after the market sell off after FOMC baba barely fell only from 85.30 down to the support but the trend wasn’t broken. This was a great sign for baba compared to some stocks that were slammed hard, like spy from 401.70 down to 392 support. That also held a solid support even in that drop which still can be a bullish look as long as that contiues
Now for baba, if this can get a pull back to 85.30 and backtest and hold this will be the next potential idea for a bounce zone. If that fails 84.11 is a support to watch but I think an 85 fail would be a bit worst of a looks
If we can remain strong and control this 86:87 level then the top of the green box above is 91.30 and the bottom of the box is 88. 30

BabaInteresting chart. 83.80-84 was previous clear reistance. We popped it finally. We couldn’t clear and hold 85.30 as support so that’ll be the key reistance above here to watch but as we come back in will baba backtest and confirm 84ish as support before a beautoful bounce up towards 87-90 areas? That’s the trade I’m watching for. I played the pop this morning and had to close out close to 85s as we lost momentum. But I am getting close to pull in another long trade here soon. Let’s see how the feds response and market response to the feds is but watch baba


Should you be concerned about falling price of your stocks?Well, the answer depends ! If we take a look at Alibaba shares, we can see that it has reached its 52 week low at 60.25. But Alibaba is more than an e-commerce store with diversified investment in cloud infrastructure, retail, internet and technology.
We all know about the disappearance act of Jack Ma and how he vanished into thin air after the last public speech years ago. Rather than speculate what happened to him, we need to understand he has long relinquish his controlling position in Alibaba and let the executive directors take charge. It's latest better than expected Q3 results have started once again to whet the appetite of many international investors and fund houses to go LONG on this company. So have I.
On the other hand, if we have to compare, i would say Amazon comes close in terms of its e-commerce part of the business but look at the chart. It is still within the bearish trend and has some time before we see it break out.
There is a saying that buying China stocks is RISKY because you never know what the CCP will do - look at the educational listed companies that plunged more than 90% in share price within the day. Strictly looking at the business part of Alibaba, I believe it has strong financial standing with tons of cash to funds its R&D and also it is usually in the forefront of technology. Not forgetting there lies a possibility of Ant Financials IPO. That could give Alibaba the catalytic boost it needs.
More importantly, if we are not peaceful over short term price volatility and constantly watch the price action, it sends nothing but frustration and anxiety to us. Then, it begs the question of WHY are you buying into this company in the first place ? Is it FOMO ? Is it some hearsay? Did you do your own due diligence ? If yes and the business has not deteriorate in any way, shouldn't the price drop be seen as a good chance to accumulate ?
I have also shared about my thoughts in diversification. Buying solely into one company does carry more risks than a basket of tech stocks like ISHARES TECH or PNQI ETF.
The latter strategy works best for those who have limited capital or recurring capital to top up each month.
Do not look at the stock market as some form of lottery ticket wins and you will be much better in years to come. Of course, this represents my view and it is not to be construed as a buy/sell advice. Please DYODD.
P/s: I am vested in both companies at time of writing.

BABA 1. BABA bounced off of Godlen pocket support at 80.1
2. Broke the down trend
3. upside targets 88.03 -->89.35 -->92.9 (d200MA)

BABA: Buy ideaBuy idea on BABA as you see on the chart because we have the breakout with force the vwap and the resistance line by a big green candle with a large green volume! Thanks!

$BABA - looking interesting for bullish reversal#Baba could be forming inverse head and shoulder after breaking out of descending wedge. If the pattern materialized, the breakout target could be $165.
Target 1 - $99
Target 2 - $125
Target 3 - $165
Risk - Fall to $58
——
Trade is done when it hit one of the target or stop loss is hit.
Disclaimer: Trading note. Not an investment advice.
