Looking for a somewhat deep correction here on BRK.If we look at price to book, it peaked at 1.57 ish and currently 1.52. it does not generally go higher than this... 1.6 on an occasion in the past.
Brk.b usually goes to at least 1.25 before it rallies again. There are occasions where it goes lower but I am not a gambler and would love to buy at 1.25
I do not anticipate that we have as severe correction as the prior situation i have highlighted, i simply think we are moving to the bottom of this megaphone pattern. Sometime BRK.B likes to dip below the megaphone pattern as a fake out before a mega rally, so that may happen too.
Bounces along the way are likely, but i think the chart plus the book value can give us a great entry soon.
BERK34 trade ideas

Berkshire Hathaway Inc. New WCA - Classic Rectangle PatternHello and thank you for taking the time to read my post. Today, we analyze Berkshire Hathaway Inc. New's chart on the weekly scale, focusing on a classic price pattern called the "Rectangle Pattern." Berkshire Hathaway Inc. New is a diversified financial services conglomerate, traded on the NYSE under the tickers BRK.A (Class A shares) and BRK.B (Class B shares).
Classic Rectangle Pattern:
The classic rectangle pattern is a chart pattern formed when the price of an asset moves between two parallel horizontal lines, representing support and resistance levels, over a period of time. In essence, it reflects a consolidation phase where the market is undecided about the direction of the trend.
Analysis:
In the case of Berkshire Hathaway Inc. New, we observe a 322-day rectangle with several touching points. The upper boundary is at 320$, and the lower boundary is at 264$. The price chart has just broken out of the rectangle and is re-testing the old resistance as support, which makes an entry interesting. All this happens while we are above the 200 EMA, which supports a bullish environment and an idea on the long side.
Additional Analysis:
The recent breakout from the rectangle pattern and the re-test of the old resistance as new support suggest a potential upward trend continuation. As we are above the 200 EMA, the bullish environment is further supported, making long positions more attractive. The price target is at 376$, which represents a potential ~17.5% price increase. On the way to the price target, we can expect to encounter resistance at 360$.
Conclusion:
The Berkshire Hathaway Inc. New weekly chart showcases a classic Rectangle Pattern, reflecting a consolidation phase in the market. The recent breakout and re-test of old resistance as support, combined with the price being above the 200 EMA, signal a potential continuation of the bullish trend. With a price target of 376$ and intermediate resistance at 360$, traders should remain vigilant and consider proper risk management strategies when entering long positions.
Company: Berkshire Hathaway Inc. New
Ticker: BRK.A (Class A shares) / BRK.B (Class B shares)
Exchange: NYSE
Sector: Diversified Financial Services
Please note that this analysis is not financial advice. Always do your own due diligence when investing or trading.
Best regards,
Karim Subhieh


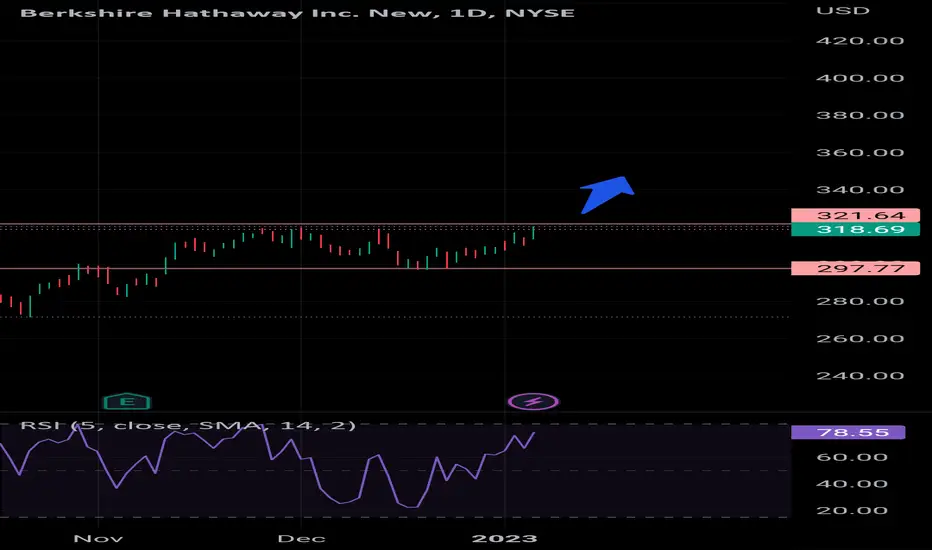
BRK.B really bullishVolume is increasing and it has earnings on Feb 27th
Are the results positive?
Well, we will know it in some days...
Entrance= Above 318.40
Take Profit= 340 or below

TrueLevel Bands: One of the Most Useful IndicatorsThe TrueLevel Bands Indicator: Why It's One of the Most Useful Indicators Out There
The TrueLevel Bands indicator is a powerful technical analysis tool that helps traders identify trends and potential reversal points in the markets. It is a versatile and customizable indicator that can be used on any financial instrument, including stocks, commodities, forex, and cryptocurrencies.
In this article, we'll explore the TrueLevel Bands indicator in detail, and explain why it's one of the most useful indicators for traders.
What Are TrueLevel Bands?
TrueLevel Bands are a type of envelope indicator that helps traders identify the upper and lower boundaries of a trading range. They are similar to Bollinger Bands, but instead of using a fixed number of standard deviations from the moving average, TrueLevel Bands use a multiple of the standard deviation that is determined by the length of the moving average.
The TrueLevel Bands indicator consists of two lines: an upper band and a lower band. The upper band is calculated by adding a multiple of the standard deviation to the moving average, while the lower band is calculated by subtracting the same multiple of the standard deviation from the moving average.
How to Use TrueLevel Bands
TrueLevel Bands can be used in a variety of ways, but their primary purpose is to help traders identify trends and potential reversal points in the markets. Here are a few ways that traders can use TrueLevel Bands:
1. Trend identification
One of the most significant advantages of TrueLevel Bands is the cloud created by the transparency of the fill color between the upper and lower bands. This cloud makes it easy to visualize the trend at a glance, without having to rely on complex technical analysis tools or methods. The cloud effect also provides a clear indication of the strength of the trend. The wider the cloud, the stronger the trend, while a narrow cloud indicates a weaker trend or consolidation. This feature is particularly useful for traders who prefer to use visual cues to make trading decisions.
TrueLevel Bands make it easy to identify the direction of the trend. When the price is above the cloud, it is considered to be in an uptrend. Conversely, when the price is below the cloud, it is considered to be in a downtrend.
2. Reversal points
TrueLevel Bands can also be used to identify potential reversal points in the markets. When the price reaches the upper band, it is considered to be overbought, and a reversal to the downside may occur. Similarly, when the price reaches the lower band, it is considered to be oversold, and a reversal to the upside may occur.
3. Support and resistance levels
TrueLevel Bands can also be used to identify support and resistance levels. When the price is trading within the bands, the upper band serves as a resistance level, while the lower band serves as a support level. Traders can use these levels to identify potential entry and exit points for their trades.
4. Volatility
TrueLevel Bands can also be used to measure volatility. When the bands are narrow, it indicates that the market is experiencing low volatility. Conversely, when the bands are wide, it indicates that the market is experiencing high volatility.
5. Fibonacci-based length options
In addition to the standard length options (250, 500, 750, 1250, 2000, and 3250), TrueLevel Bands also offer Fibonacci-based length options. These lengths are spaced out in a way that allows traders to capture different time frames and market movements, from short-term fluctuations to longer-term trends.
The Fibonacci-based length options were chosen by multiplying 125 (which represents 6 months of daily data) by a sequence of Fibonacci numbers, starting with 2. The resulting lengths are: 250 (125 x 2), 375 (125 x 3), 500 (125 x 4), 325 (125 x 5), 750 (125 x 6), 1000 (125 x 8), 1250 (125 x 10), 1625 (125 x 13), 2000 (125 x 16), 2625 (125 x 21), 3250 (125 x 26), 3750 (125 x 30), and 4250 (125 x 34).
By using these Fibonacci-based length options, traders can take advantage of the natural patterns and rhythms that exist in the markets. These lengths are spaced out in a way that allows traders to capture different time frames and market movements, from short-term fluctuations to longer-term trends.
Why TrueLevel Bands Are More Accurate Than Moving Averages
Moving averages are a popular technical analysis tool that help traders identify trends and potential reversal points in the markets. However, they have a few drawbacks that make them less accurate than TrueLevel Bands.
1. moving averages are based on past prices, which means they lag behind the current market conditions. This can lead to false signals and missed trading opportunities.
2. moving averages use a fixed number of periods, which may not be suitable for all market conditions. For example, a 50-period moving average may work well in a trending market, but it may be less effective in a choppy or range-bound market.
TrueLevel Bands, on the other hand, use a multiple of the standard deviation that is determined by the length of the moving average. This means that the bands are more responsive to changes in market conditions, and they can adapt to different market environments.
Conclusion
The TrueLevel Bands indicator is a powerful and versatile tool that can help traders identify trends, potential reversal points, support and resistance levels, and measure volatility. It offers a range of length options, including Fibonacci-based options, that allow traders to capture different time frames and market movements.
Compared to moving averages, TrueLevel Bands are more accurate and adaptable to changing market conditions. They can help traders make better-informed trading decisions and improve their overall trading results.
If you're looking for a reliable and versatile technical analysis tool, give the TrueLevel Bands indicator a try. It might just be the missing piece in your trading toolbox.

Berkshire Hathaway ,,, Pullback Uptrend
I suppose it is a pullback to a broken price level. It could come back from about 320 to 321 , entry suggested after finding a good trigger by setting a sure SL .

Buffett's Strategy for Modern MarketsWarren Buffett's Investment Model: Adapting the Oracle of Omaha's Strategies to Today's Markets
As someone deeply inspired by Warren Buffett's investment principles, I've always been fascinated by how his strategies can be adapted to the ever-changing financial landscape. In exploring this subject, my goal is to share valuable insights that fellow investors can apply in today's dynamic markets while still drawing from the wisdom of the Oracle of Omaha.
Warren Buffett has long been hailed as one of the greatest investors of all time. His value-based investment strategy has proven to be wildly successful for decades. However, as the financial landscape evolves, it's essential to examine the continuing effectiveness of his approach in today's markets. This article will explore key aspects of Buffett's investment model and assess which elements remain relevant and which may have lost their edge.
Section 1: The Core Principles of Warren Buffett's Investment Model
1.1 Long-term value investing
a. Patience and discipline: Buffett's approach requires investors to patiently wait for opportunities to buy undervalued stocks and hold them for the long term, often ignoring short-term market fluctuations.
b. Margin of safety: Buffett emphasizes purchasing stocks at a discount to their intrinsic value, providing a margin of safety and reducing the downside risk.
c. Dividends and reinvestment: Buffett's model often focuses on companies that pay stable and growing dividends, which can be reinvested to compound returns over time.
1.2 Moats and competitive advantage
a. Pricing power: Companies with strong pricing power can increase prices without significantly affecting demand, providing a competitive edge.
b. Brand recognition: A strong brand can create customer loyalty, making it difficult for competitors to gain market share.
c. Cost advantage: Companies with a cost advantage can offer products or services at lower prices or enjoy higher profit margins, increasing their competitiveness.
1.3 Focus on quality businesses
a. Financial health: Buffett seeks companies with low debt levels and strong cash flow generation, indicating financial stability.
b. Management quality: A capable management team is crucial to a company's success, with Buffett prioritizing companies led by experienced and shareholder-oriented leaders.
c. Consistent earnings growth: Companies with a history of consistent earnings growth are more likely to deliver strong returns over time.
Section 2: The Changing Landscape: Points of Buffett's Strategy Losing Effectiveness
2.1 Ignoring technology and growth stocks
a. Missed opportunities: Buffett's aversion to technology stocks has caused him to miss out on significant investment opportunities in companies like Amazon, Google, and Apple.
b. The rise of disruptive technologies: The rapid pace of technological innovation has led to disruptive companies reshaping entire industries, with early investors in these companies often reaping substantial rewards.
c. The importance of adaptability: Investors should be willing to adapt their strategies to recognize the changing landscape and embrace new investment opportunities.
2.2 Relying on financial statement analysis
a. The limitations of traditional metrics: Metrics like price-to-earnings (P/E) and price-to-book (P/B) ratios may not accurately capture the value of companies with significant intangible assets.
b. The role of intangibles: Intangible assets, such as intellectual property, customer relationships, and brand value, are increasingly important drivers of business success.
c. Alternative valuation methods: Investors should consider incorporating alternative valuation methods, such as discounted cash flow (DCF) analysis and relative valuation techniques, to better assess a company's true worth.
Section 3: Adapting Buffett's Investment Model to Today's Markets
3.1 Embracing technological innovation
a. Identifying future industry leaders: Investors should seek out companies with innovative technologies that have the potential to become industry leaders in their respective sectors.
b. Focusing on long-term growth potential: While some technology and growth stocks may appear overvalued by traditional metrics, their long-term growth potential may justify a higher valuation.
c. Balancing risk and reward: Investing in technology and growth stocks may carry higher risks, but also the potential for greater rewards, which can be balanced through careful portfolio diversification.
3.2 Diversification across industries and geographies
a. Expanding investment horizons: By investing in a variety of industries and regions, investors can capitalize on global growth opportunities and reduce dependence on specific sectors or markets.
b. Mitigating regional risks: Diversification across geographies helps to mitigate risks associated with regional economic downturns or political instability.
c. Harnessing the potential of emerging markets: Investors can seek opportunities in emerging markets with strong growth potential and favorable demographic trends, further diversifying their portfolios.
3.3 Incorporating ESG factors
a. Long-term sustainability: Companies with strong ESG performance are more likely to be sustainable in the long term, aligning with Buffett's long-term value investing approach.
b. Improved risk management: Incorporating ESG factors into the investment decision-making process can help identify potential risks and opportunities that may not be apparent through traditional financial analysis.
c. Growing investor demand: As ESG investing gains traction, companies with strong ESG performance may attract increased investor interest, potentially driving higher valuations and returns.
Warren Buffett's investment model has been highly successful for decades, but it's essential to adapt his principles to the ever-changing financial landscape. By embracing technological innovation, diversifying investments, and incorporating ESG factors, investors can continue to benefit from the wisdom of the Oracle of Omaha while navigating the complexities of today's markets.


BRK.B 1D long conservative trend tradeConservative trend trade #2
+ long balance
+ volumed ICE
+ support zone
+ 2Sp + volume
Calculated affordable stop
1 to 2 target
Monthly chart analysis:
+ long balance
- neutral zone
+ 1/2 correction
+ volumed ICE
+ 2Sp + test

Berkshire HathawayThe Berkshire Hathaway company in the face of all the financial uncertainty is the one that is resisting the fall the most if we compare it to other companies in the same sector. Therefore, before an economic recession may be the least likely to fall and with it a company that would be safe to invest.

SasanSeifi 💁♂️BRK.B / 1D ⏭ $321 /$330 ❗HI TRADERS ✌The possible scenario of BRK.B is specified. I think that if the dynamic resistance is broken and the price stabilizes, it will grow up to the target range of $321 and $330.
It is important to maintain the $306 and $300 support range.
let's see...
❎ (DYOR)...⚠⚜
WHAT DO YOU THINK ABOUT THIS ANALYSIS? I will be glad to know your idea 🙂✌
IF you like my analysis please LIKE and comment 🙏✌

$BRK.B with a bullish outlook following its earnings #StocksThe PEAD projected a bullish outlook for $BRK.B after a positive under reaction following its earnings release placing the stock in drift A with an expected accuracy of 81.82%.

Berkshire Hathaway Inc. will see a correction in wave IIGrand Super Cycle I finished in Feb. '22.
From the beginning until today its one of the biggest successes in wall street history. Nevertheless, investors take their profit now.
On the right side in red I mentioned lots of gaps from the past. To reach the 0.382-Fib retracement is a common behavior for wave II and often seen in the past.

berkshire hathwaytrendline support expecting this stock to rally, whenever trendline support is seen price rallies

BRK.B LONG IDEA.2ND stock trading idea!!
Open = 305.40
Target/TP = 320.00
SL= 299.50
Opening level = 305.40 is a significant level in the anticipated long-term Bullish trend that has just recently started. (Continuation Level)
Closing level = 320.00 end of Long term Bullish trend (Major Key Level )
LONG TERM trend which has been in play Since OCT/22 = 290.00 - 350.00 (Target)
(it is in its beginning stages.)
things to consider (possible rebalancing taking place at this LOI.
There are multiple indicators of price going further down that are technical in nature, I see INVERSE H&S & DB
Obvious on higher timeframes and have been forming over a long period of time.
(THIS IDEA IS MAINLY BASED ON TECHNICALS)
(this is a personal idea based on what i am seeing MY CHART.)

BRK.A #RUGPULL?Stalling on weekly resistance.
Next stop 320k after retest of quarterly support at 408k?
NYSE:BRK.A

BRK.A Potential for Bullish Continuation| 12th January 2023Looking at the H4 chart, my overall bias for BRK.A is bullish due to the current price being above the Ichimoku cloud, indicating a bullish market. Looking for a buy entry at 480527.01, where the previous high is. Stop loss will be at 445251.00, where the recent swing low is. Take profit will be at 541960.00, where the previous swing high is.
Any opinions, news, research, analyses, prices, other information, or links to third-party sites contained on this website are provided on an "as-is" basis, as general market commentary, and do not constitute investment advice. The market commentary has not been prepared in accordance with legal requirements designed to promote the independence of investment research, and it is therefore not subject to any prohibition on dealing ahead of dissemination. Although this commentary is not produced by an independent source, FXCM takes all sufficient steps to eliminate or prevent any conflicts of interest arising out of the production and dissemination of this communication. The employees of FXCM commit to acting in the clients' best interests and represent their views without misleading, deceiving, or otherwise impairing the clients' ability to make informed investment decisions. For more information about the FXCM's internal organizational and administrative arrangements for the prevention of conflicts, please refer to the Firms' Managing Conflicts Policy. Please ensure that you read and understand our Full Disclaimer and Liability provision concerning the foregoing Information, which can be accessed on the website.

Buying Berkshire's break higher.Berkshire Hathaway B - 30d expiry - We look to Buy a break of 321.11 (stop at 312.39)
Daily signals are mildly bullish.
Short term momentum is bullish.
There is no clear indication that the upward move is coming to an end.
A break of the recent high at 320.50 should result in a further move higher.
This is curremtly an actively traded stock.
Our profit targets will be 342.8 and 348.8
Resistance: 320.50 / 330.00 / 340.00
Support: 314.00 / 305.00 / 297.00
Please be advised that the information presented on TradingView is provided to Vantage (‘Vantage Global Limited’, ‘we’) by a third-party provider (‘Signal Centre’). Please be reminded that you are solely responsible for the trading decisions on your account. There is a very high degree of risk involved in trading. Any information and/or content is intended entirely for research, educational and informational purposes only and does not constitute investment or consultation advice or investment strategy. The information is not tailored to the investment needs of any specific person and therefore does not involve a consideration of any of the investment objectives, financial situation or needs of any viewer that may receive it. Kindly also note that past performance is not a reliable indicator of future results. Actual results may differ materially from those anticipated in forward-looking or past performance statements. We assume no liability as to the accuracy or completeness of any of the information and/or content provided herein and the Company cannot be held responsible for any omission, mistake nor for any loss or damage including without limitation to any loss of profit which may arise from reliance on any information supplied by Signal Centre.

Brk b testing weekly ceilingDouble bottom occurred a few weeks ago hence the price went up but now it meets the ceiling prices.
The issue here therefore is will it break thru or bounce downwards.
One thing for sure, brk is fundamentally strong.
In the event of a crisis, this stock instead outperformed.Why did the stock rebound so quickly?
Perhaps the crisis is coming and investors are looking for stocks with a high safety margin as an investment target.
Also the company has plenty of cash to protect against risks, which is believed to be one of the reasons to attract investment attention.
Subscribe and Share.

BERK faces to test resistance New board member will be testing the sentiment of owners. Price action faces resistance on the new lower low. Failing to breach may end up in a new short trend.

I’m stumped on berkCould go either way probably would want to see a break above the previous high though but that could be a trap and I would have to do some more research on where they make money moral’s come in when it’s fast food , sugar and oil things that kills people and kills the planet plus in a recession people stop spending so idk

Falling Wedge and RSI DivergenceA number of reasons to take a look at Warren Buffett. Waiting until earnings a done to see how this holds up!
