Comerica (NYSE: CMA) Reports First Quarter 2025 Earnings ResultsComerica Incorporated (NYSE: NYSE:CMA ), together with its subsidiaries, a company that provides financial services in the United States, Canada, and Mexico reported her first quarter 2025 earnings results today before the bell.
The results are available on the Investor Relations section of Comer
10,705.44
0.01 BRL
3.74 B BRL
26.11 B BRL
About Comerica Incorporated
Sector
Industry
CEO
Curtis Chatman Farmer
Website
Headquarters
Dallas
Founded
1973
ISIN
BRC1MABDR006
FIGI
BBG00RD5ZL81
Comerica, Inc. engages in the provision of financial services. It operates through the following segments: Commercial Bank, Retail Bank, Wealth Management, Finance, and Other. The Commercial Bank segment offers various products and services, including commercial loans and lines of credit, deposits, cash management, capital market products, international trade finance, letters of credit, foreign exchange management services, and loan syndication services. The Retail Bank segment includes personal financial services, consisting of consumer lending, consumer deposit gathering and mortgage loan origination, and offers consumer products, including deposit accounts, installment loans, credit cards, student loans, home equity lines of credit, and residential mortgage loans. The Wealth Management segment offers fiduciary services, private banking, retirement services, investment management and advisory services, investment banking, and brokerage services. The Finance segment includes the corporation's securities portfolio and asset and liability management activities. The Other segment includes the income and expense impact of equity and cash, tax benefits, charges of an unusual or infrequent nature that are not reflective of the normal operations, and miscellaneous other expenses of a corporate nature. The company was founded in 1973 and is headquartered in Dallas, TX.

Market Structure: Seeing In SwingsMarket Structure is simply making distinctions in price flow. its putting structure around what looks like chaos so that we have a way to measure and orient ourselves to any market in any timeframe. When I look at a market, I want to see objectively in swings.
Swings are the common thread that wea

Top SHORT picks 9/12These 4 are my top Short ideas for today into the future until the price stays below the Red TrapZone.
The picks are based on momentum, volume and price action.

ZION,UMBA,WAL,CMA 5d 202303145 day snapshot of 5 regional banks after Moody's downgrade on Mar-14-2023 and collapse of Silicon Valley Bank and Signature Bank
ZION, UMBA, WAL, CMA

US Banking in turmoilFollowing the weekend banking crisis with Silicon Valley Bank, Silvergate and Signature Bank, we're seeing massive contagion risk as bank runs occur. Was the intervention by the FDIC, Federal Reserve Bank, and Treasury, enough to easy concerns?

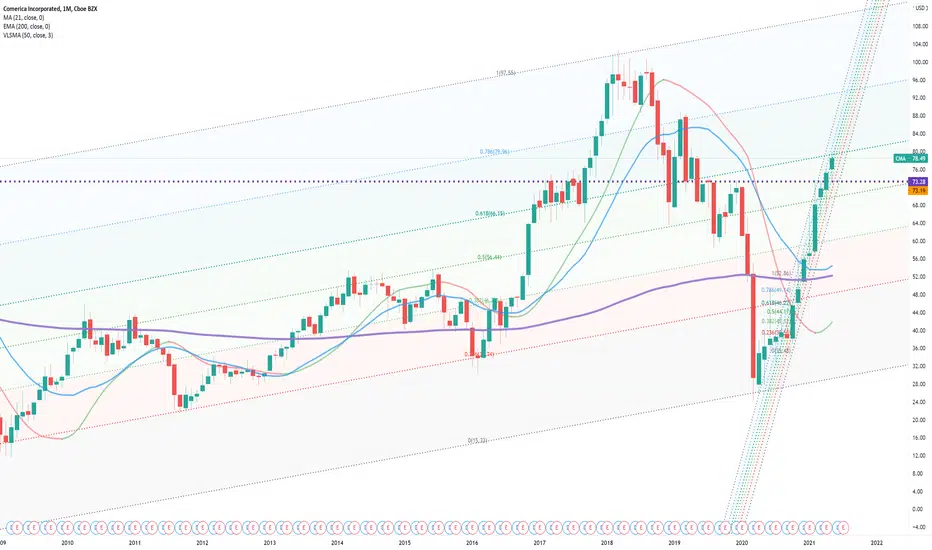
CMA - Bottom Within ChannelI have drawn a large channel in solid white
this is accompanied by a triangle structure but more importantly it as a double bottom for price
I have shown this double bottom with a bars pattern along the lower line of the triangle
This is where I think price will turn a recovery

Bearish divergence on CMA Daily and 4HWeekly (not shown):
Possible bearish divergence coming up. Impulse still green, but is shows prices around 101 were rejected and price closed much lower.
MACD-Histogram still rising, as well as EFI. sRSI declining, although it could cross.
Daily
Bearish divergence on MACD-H, MACD lines, EFI and eve

CMA - LONG - ZOOM-OUTOh, it's a long way home
It's a long way home
In the night alone
(Johnny Hallyday)
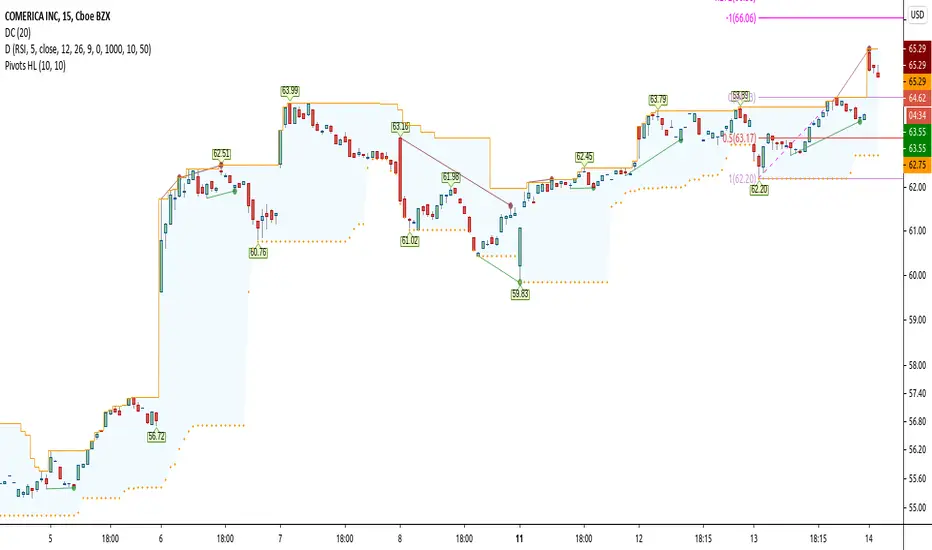
Cup and Handle Earnings Tomorrow BMOThe handle is in a rectangle. Financials have been hot but who knows when the sector will rotate out? The top line of the rectangle should be red as it is resistance.
Support at handle low 65.66 and Mid cup 48.85 Depth is 49.15 LONG ENTRY is 73.55
No recommendation

Breakout CorrectedWe have corrected the breakout today. As long as we are holding above yesterday's high we may likely rise again.
See all ideas
Summarizing what the indicators are suggesting.
Oscillators
Neutral
SellBuy
Strong sellStrong buy
Strong sellSellNeutralBuyStrong buy
Oscillators
Neutral
SellBuy
Strong sellStrong buy
Strong sellSellNeutralBuyStrong buy
Summary
Neutral
SellBuy
Strong sellStrong buy
Strong sellSellNeutralBuyStrong buy
Summary
Neutral
SellBuy
Strong sellStrong buy
Strong sellSellNeutralBuyStrong buy
Summary
Neutral
SellBuy
Strong sellStrong buy
Strong sellSellNeutralBuyStrong buy
Moving Averages
Neutral
SellBuy
Strong sellStrong buy
Strong sellSellNeutralBuyStrong buy
Moving Averages
Neutral
SellBuy
Strong sellStrong buy
Strong sellSellNeutralBuyStrong buy
Displays a symbol's price movements over previous years to identify recurring trends.