Coinbase: Catching BreathCoinbase is currently catching its breath in a sideways movement. We still attribute more upside potential to the ongoing wave b in orange, expecting it to rise close to the resistance at $422.11. However, wave c should start below this mark and ultimately complete the blue wave (ii) above the support at $138.45. The subsequent blue wave (iii) should then carry the price significantly above the $422.11 mark.
C2OI34 trade ideas

Coinbase UpdatePrice continues to trade sideways. We have already tagged the 1.0, made it in between the 0.382 & 0.5, and have all the required waves in place for a top to be made. Much like Tesla, the only move higher from here in an impulsive wave is an ED. I find it much more likely that a top has already been struck and we have already begun our minor B wave. We could still make another high, but if we do I think it will be minimal and would be as an irregular b wave. Ideally, we will find out what is in store this week.
Once B starts, as of now, I expect price to fall back to the $150-$160's. Like I said, hopefully we start the move lower this week. I imagine minor B will take 2-4 weeks to complete.

COIN BASE BREAKOUT + FLAG SETUPCoin has nice flag pattern with this BTC strength and MSTR strenght. Thinking this can get picked up.
We are flagging for the last 5 days with a bigger break starting from March also setting up. Thinking target to the 200sma and risk down to the 9ema

Coinbase Entries2 scenarios and the corresponding buy zones on the retest.
I have a feeling I will be waiting for another good entry on this for a while since I miss the trend breakout retest on the 4 hr.

COIN: backtest for a big trend!COIN: backtest for a big trend!
-Engulfing candle confirmed demand at the bottom, together logical with volume.
-Backtest expectation with low supply volume, entry and up!
.
US STOCKS- WALL STREET DREAM- LET'S THE MARKET SPEAK!

Under 400$ is a steal Strong move off 150 support. They had a 180 sell downgrade announced from some clowns today they'll be revising there targets shortly. COIN will be used be everyone and there grandma soon enough. Consumer/government dollars pouring in is insane this company is not going anywhere they also just realsed plans for BTC Yield Fund, offering 4-8% APY to non-US institutional investors through a limited leverage cash-and-carry trade strategy.
I don't think we'll be falling below 178 would be a great entry if your lucky enough.

Coinbase Global (COIN) – Bridging Crypto and Traditional FinanceCompany Snapshot:
Coinbase NASDAQ:COIN is cementing its role as the gateway to the crypto economy, offering secure trading, custody, and institutional-grade financial services—positioning itself for expansion well beyond retail.
Key Catalysts:
Bank Charter Ambitions 🏦
Exploring a bank charter, potentially evolving into a full-service financial institution
Would diversify revenue and boost regulatory credibility, key in the maturing crypto sector
Institutional Growth Momentum 📈
Extending credit to major players like CleanSpark
Building sticky, high-value relationships and reducing retail dependency
Strengthening Financials 💰
14.8% pre-tax margin
39.16% profit contribution margin → Clear operating leverage and path to sustainable, scalable profitability
Trusted Brand Advantage 🛡️
Strong institutional trust + regulatory compliance reputation → defensible moat in a volatile industry
Investment Outlook:
✅ Bullish Above: $160.00–$162.00
🚀 Target Range: $280.00–$290.00
🔑 Thesis: Regulatory expansion + institutional scale-up + financial efficiency = long-term crypto-finance powerhouse
📢 COIN: Not just a crypto exchange—an evolving financial institution for the digital future.
#CryptoFinance #Coinbase #DigitalAssets #Fintech #InstitutionalGrowth #BankingFuture

Coinbase - A lurking giant?Whenever there's activity in the cryptocurrency space, good or bad, NASDAQ:COIN may benefit from heightened transaction rates.
Some like the concept of cryptocurrencies, but not what's involved in purchasing and holding them.
Some prefer selling 'picks and shovels' rather than digging for gold themselves...
In steps platforms like Coinbase, that facilitate a degree of exposure to the cryptocurrency scene without holding coins directly yourself.
Our Team has identified Bullish potential in COIN should price be able to hold the ~$200.00 region.
We have also identified that significant Bearish continuation risk lurks beneath ~$184.00.
How will Coinbase perform over the coming period? Is there a Bull lurking?
Time will tell...
We're inspired to bring you the latest developments across worldwide markets, helping you look in the right place, at the right time.
Thank you for reading! Stay tuned for further updates, and we look forward to being of service along your trading & investing journey...
Disclaimer: Please note all information contained within this post and all other Bullfinder-official Tradingview content is strictly for informational purposes only and is not intended to be investment advice. Please DYOR & Consult your licensed financial advisors before acting on any information contained within this post, or any other Bullfinder-official TV content.

Strong Coinbase long positionGood price action with firm bounce off the the key historical $150ish support. Stock is still heavily correlated to BTC of course, but barring any crazy crashes this has a lot of room to go higher from a technical standpoint. Can't ask for a much easier chart to draw/trade imo.

[COIN] Coinbase investment ideaI will enter heavy on this stock to follow the crypto explosion I guess will happen soon regarding the fundamentals.
I already took a long some months ago but here my conviction continue to grow.
Great Trade !

COINBASE (COIN) | 3W Outlook
Price just closed above $209.64 — reclaiming the 0.236 Fib level with a +19.77% candle! We're now watching to see if this breakout has the momentum to continue toward the 0.382 ($221.54) and eventually retest the 0.5 zone ($245.99).
🟣 Previous High at $349.75 remains a major target — but notice how price respected that $142.58 support and launched with force.
🔄 Market structure still favors bulls in this mid-term reversal setup. A break and hold above $221 could be the confirmation many are waiting for.
🚀 Next stops: $245.99 → $270.43 → $305.24 🎯 Long-term goal: $349.75 and beyond.

$COIN $83-100 before $500+NASDAQ:COIN is still in the process of correcting down to it's target at $100 (with a possibility of a wick down to $83) and after we get there, I think we'll start our next leg up which will take us past $500.
Why do I still think we have another leg down? Well if you look at the chart, you'll see that we've only had 3 waves down on the downside and the 5th wave looks to be coming soon here.
After we bottom, I think it's likely that we'll see a 5-7x, with the most likely target of the move being $770, which is likely to come in 2026-2027.

Why Coinbase (COIN) Shares Are RisingWhy Coinbase (COIN) Shares Are Rising
As the Coinbase (COIN) stock chart shows, trading closed yesterday above the $200 mark — for the first time since March.
Since the beginning of April, COIN's share price has risen by nearly 20%, while the S&P 500 index (US SPX 500 mini on FXOpen) has declined by approximately 2%.
Bullish Drivers Behind COIN’s Price Rise
According to media reports, several factors are contributing to the bullish momentum:
→ Yesterday’s announcement that Coinbase and PayPal are expanding their partnership in the areas of crypto payments and decentralised finance (DeFi). The collaboration aims to increase the adoption of the PYUSD stablecoin and integrate it into merchant settlements.
→ The anticipated adoption of US stablecoin legislation, designed to establish a regulatory framework for the use of stablecoins. This is being supported by the Trump administration’s progressive stance on cryptocurrencies, including the appointment of crypto-friendly officials, the creation of a strategic crypto reserve, and other pro-crypto initiatives.
Technical Analysis of COIN Stock
The psychological level of $150, which served as strong support in 2024, has proven resilient again in April 2025. However, despite the rapid rise in price from $150 to $200 in under three weeks, there are reasons to believe that bullish sentiment may begin to fade:
→ The COIN share price remains within a downward trend, highlighted by a channel originating in early 2025.
→ The upper boundary of the channel may act as a resistance level.
→ Bears have previously demonstrated control in the $225–240 zone, where the price declined sharply (marked with a red rectangle).
This article represents the opinion of the Companies operating under the FXOpen brand only. It is not to be construed as an offer, solicitation, or recommendation with respect to products and services provided by the Companies operating under the FXOpen brand, nor is it to be considered financial advice.


Long Coinbase as a proxy bet on Crypto until end of yearUntil proven otherwise I must be under the assumption that the worst is behind us for the time being. That being said, more debasement is infinitely more likely than less, so long risk assets.
-looking for a lovely retest of the broken downtrend, coinciding with a nice support level within the next 30 days. This has to be a buy for me (in the green box).
-looking to close position late this year (likely December)

Coinbase Global, Inc. Goes Bullish —The Correction Is Over!COIN's bearish volume peaked November 2024. Ever since this date, peak bearish volume continued to drop. As we approached today, the lowest price since February 2024, COIN ended up closing with a green bar rather than a red one; the bears are gone.
I am giving you technical analysis in a very simple way. When volume and price produce a divergence, it means that we are on the verge of a change of trend.
Coinbase found support just below the September 2024 low. This support is also a long-term higher low compared to February 2024.
The correction was big and strong. Lasting more than 4 months and reaching almost 60%. A huge drop, but the market never drops forever, it never moves in one single direction, it moves in waves.
Did you enjoy the bearish wave? Did you suffer through this wave?
No problem, after a bearish wave comes a bullish wave. The good news is that the bearish wave lasted 4 months but the bullish wave will go for 8-12. That's a great deal. Go down 4 months and then growth for 8 months straight.
Coinbase is preparing to grow, together with Bitcoin, NVIDIA and the Stock market.
The bears are out. We will gain control of the market. It is the bulls turn. We are going up.
Namaste.

whats new? trump for kingi got an alert at 130 and a boner for 103
waiting on word on April 9th... fomc decision
no reason shit gonna start pumping (currently), ya kno?!.

i missed the target before -30% i'd like to offer you The Bottomt's awkward when 'all models are wrong, some are merely useful' when i called 'the fear is in the streets' with a buy action forward. boy was i wrong (and so paid the price for that call)
but with -30% additional downside i've been stalking this patiently.. and +/- 5% diff i think This is it a good bottom as any now (you cant ever time them right) but merely highER probability of the bottom
Here is why.
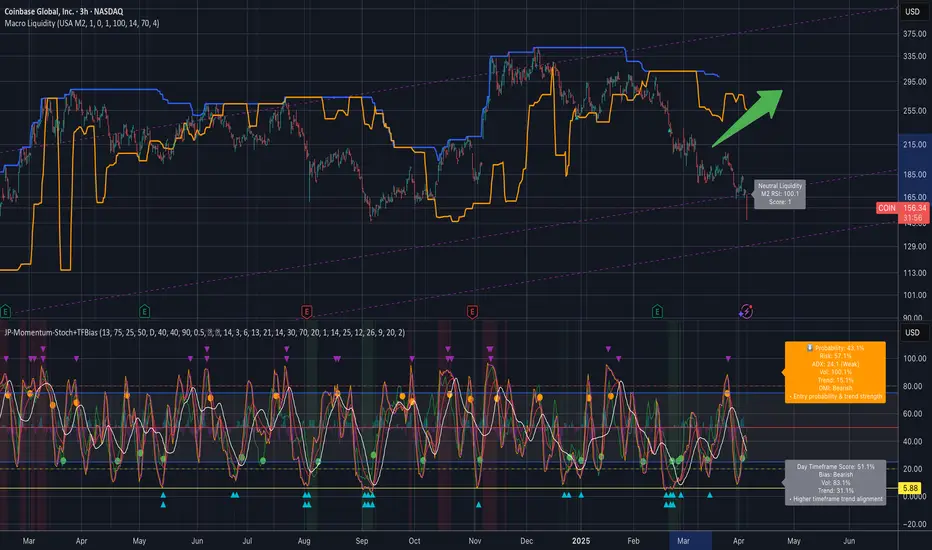
Overall Price Action
• COIN appears to be trading within a broad upward‐sloping channel since last year’s lows, though recent sessions show a pullback from the high‐$300s down to the mid‐$100s.
• The stock has been staging multi‐month rallies followed by pronounced corrections, indicating that volatility remains high.
Short‐Term (Days to ~2 Weeks)
• Current Bias: Bearish/Consolidation - stay cautious
Reasoning: Momentum indicators (e.g. the stochastic overlays) are in lower ranges or rolling over from mid‐levels, and the daily timeframe readout references a bearish tilt with relatively weak trend strength (low ADX, sub‐50% probability).
Key Levels:
• Immediate Support: Around ~150–145 (a break below opens room toward ~130–125).
• Short‐Term Upside: A rebound and close above ~165–170 would help neutralize the immediate downtrend and could invite a bounce toward ~180.
• Confidence: Moderate (about 50%) given the mixed signals on momentum and the broader market volatility.
Near‐Term (2–6 Weeks)
• Current Bias: Cautiously Bullish if support holds; risk of deeper pullback if ~145 fails
Reasoning:
• The purple channel on the chart suggests that price may still be in a rising structure overall.
• If COIN defends that lower‐channel region near 130–150 and momentum begins to turn, a bounce toward the mid‐$180s or even low‐$200s is plausible.
• Conversely, if broader crypto markets or equities weaken further, the stock could see a retest of the lower trend boundary around the low‐$100s.
Key Levels:
• Upside Targets: ~185, then ~200–210 as a bigger pivot.
• Downside If Support Breaks: ~120–130.
• Confidence: Moderate (around 60%) on a bounce scenario, but keep watch for major support to confirm.
Long‐Term (6+ Weeks to Multiple Months)
Current Bias: Constructive but Volatile
Reasoning:
• The broader up‐channel hints COIN may be in a longer‐term recovery cycle from 2022 lows, but large swings remain likely due to the stock’s sensitivity to crypto sentiment.
• Sustained closes above ~$200–210 would solidify the bullish structure and open the door toward the mid‐$200s, possibly higher if the channel holds.
• A breakdown below ~$120 would negate the broader uptrend and suggest a return to deeper support in the double‐digit zone.
Key Levels:
• Main Resistance: ~250–270 (top portion of the channel if momentum truly resurges).
• Deep Support: ~100–120, critical to maintain a longer‐term bullish outlook.
• Confidence: Moderate‐Low (roughly 50%) given macro uncertainties; confirmation of trend strength would come from multiple weekly closes above or below these key thresholds.
So what do i think? its about Time-in-The-Market, not Timing-The-Market
The Bottom Line
Short Term : Leaning bearish unless price reclaims ~165–170.
Near Term : Watch ~145 and ~130–135 as critical support—if those levels hold, a push toward the high‐$100s is plausible.
Long Term : The up‐channel remains in play, but a break below ~120 would undermine the bullish structure. Upside targets could extend into the mid‐$200s if broader momentum and crypto sentiment remain supportive.
Opening (IRA): COIN March 21st 220 Covered Call... for a 215.96 debit.
Comments: High IV + weakness. Selling the -85 delta call against shares to emulate the delta metrics of a 16 delta short put, but with the built-in defense of the short call. Going lower net delta due to the shorter duration (35 DTE).
Metrics:
Buying Power Effect/Break Even: 215.96/share
Max Profit: 4.04
ROC at Max: 1.87%
50% Max: 2.02
ROC at 50% Max: .94
Will generally look to take profit at 50% max, roll out short call if my take profit is not hit.

COINBASE GLOBAL - Technical Analysis Key Observations:
Elliott Wave Structure: COIN has been trading within a clear Elliott Wave pattern across the timeline shown. The chart displays a complete 5-wave impulse followed by a corrective phase. Currently, we are observing the development of another impulse wave which could be signaling the start of a new bullish cycle.
Fibonacci Levels: The stock finds significant support and resistance at key Fibonacci levels. Notably, after touching the 0.618 Fibonacci retracement level at approximately $239.3, COIN shows signs of a bullish reversal, initiating the potential formation of a 3rd wave which often is the strongest and longest.
Channel Trading: COIN has respected a rising channel, bouncing off the lower bounds and facing resistance at the upper. The interaction with these channel lines provides crucial entry and exit points.
Technical Indicators:
Volume: Trading volume appears to corroborate the wave counts, with spikes in buying volume at the start of impulse waves and increased selling pressure during corrective phases.
RSI: The Relative Strength Index shows fluctuating momentum, with recent readings heading towards overbought territory, which aligns with our observation of the beginning of a potentially strong upward wave.
Future Projections:
If the bullish momentum continues, and COIN respects the Elliott wave pattern, the next significant resistance is expected at the 1.618 level around $575.70. However, a break below the current support at the 0.618 level could invalidate this bullish outlook and may lead to a retest of lower support levels.
Trading Strategy:
Long Position: Traders might consider taking a long position near the 0.618 Fib level with a stop-loss just below it. The target would be the 1.618 Fib level, aligning with the peak of the projected 3rd wave.
Short Position: A break below the 0.618 Fibonacci level could be used as a signal to initiate a short position targeting the next key support level.
Conclusion:
COIN exhibits a strong technical structure that offers potential for both bullish and bearish trades depending on key levels. Monitoring these levels along with volume and RSI can provide valuable signals for entry and exit points.

COIN - what to expecthi traders
COIN stock looks bad.
Monthly close is upon us and it looks like it's gonna be a bearish engulfing candle.
In the next few weeks I expect a bounce and retest of the previous support around 245$ where we should get a rejection and the continuation of the downtrend.
We can see a bearish divergence in the monthly time frame.
COIN's chart looks pretty similar to the BTCUSDT chart that we analyzed today:
Recommended strategy:
1. Short around 245$ area and take profit near 180$.
2. Play the bounce from 180$
Good luck

Investment of the year!NASDAQ:COIN is following the price action of palantir. After making a cup it is retesting the 0.618 for months now and is showing some strength. After previous ATH gets broken it will teleport out of the handle to the 1.272

Coin geometry 3 hours chart going up in whilethis is slight update to the previous video about coin
it will continuum down in the channel for while
then rally up for long term traders
