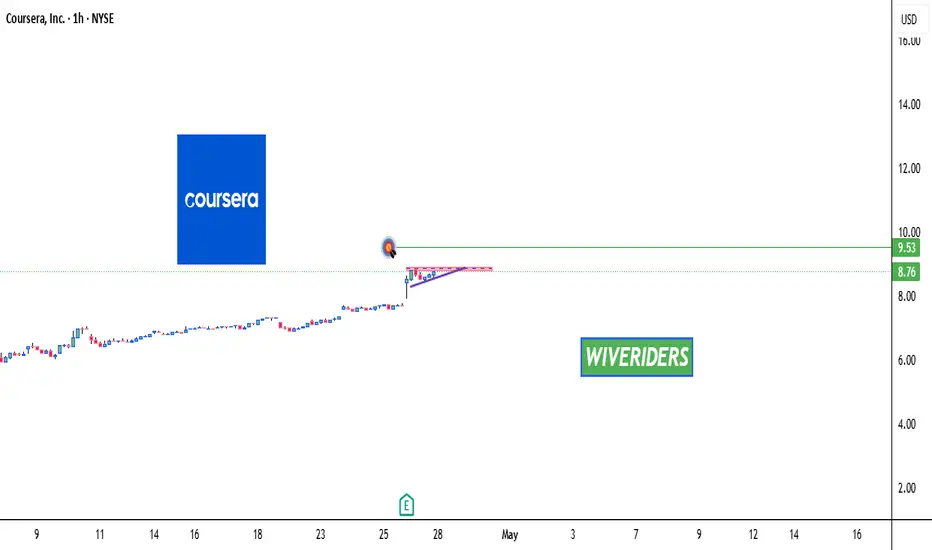
COUR ready to launch?Incredible chart and breakout approaching,
Above $12 we can see $16 in a few months, This can be a great addition to the long term account!
−0.001 BRL
−428.74 M BRL
3.74 B BRL
About Coursera, Inc.
Sector
Industry
CEO
Greg M. Hart
Website
Headquarters
Mountain View
Founded
2011
ISIN
BRC2OUBDR008
FIGI
BBG017K56L15
Coursera, Inc. is an online learning platform, which engages in the provision of online courses and degrees from universities and companies. It offers arts, chemistry, engineering, food, and nutrition, health, humanities, law, medicine, and music. The firm operates through the following segments: Consumer and Enterprise. The Consumer segment targets individual learners seeking to obtain hands-on learning, gain valuable job skills, receive professional-level certifications, and otherwise increase their knowledge to start or advance their careers. The Enterprise segment consists of serving businesses, governmental organizations, and academic institutions by providing an intuitive online platform with access to job-relevant educational content enabling them to train, upskill, and reskill their employees, citizens, and students, faculty, and staff, respectively. Coursera was founded by Daphne Koller and Andrew Y. Ng in 2011 and is headquartered in Mountain View, CA.
Related stocks
COURSERA Forming Bullish Continuation Patterns 🚨 $COURSERA Forming Bullish Continuation Patterns 🚨
$COURSERA is forming bullish continuation patterns and is approaching a key red resistance zone. A breakout above this level could signal a strong bullish move, with the first target at the green line level.
📈 Technical Overview:
Pattern: Bulli
Another 10 bagger potentialComparing the market cap of DUOL and COUR, I think this is very likely to happen!
vs
Show me a ticker with the potential to disrupt the educational system more than COUR!
Go to the platform and try it you will figure it out!
This platform democratized learning, I got my first certificate 9

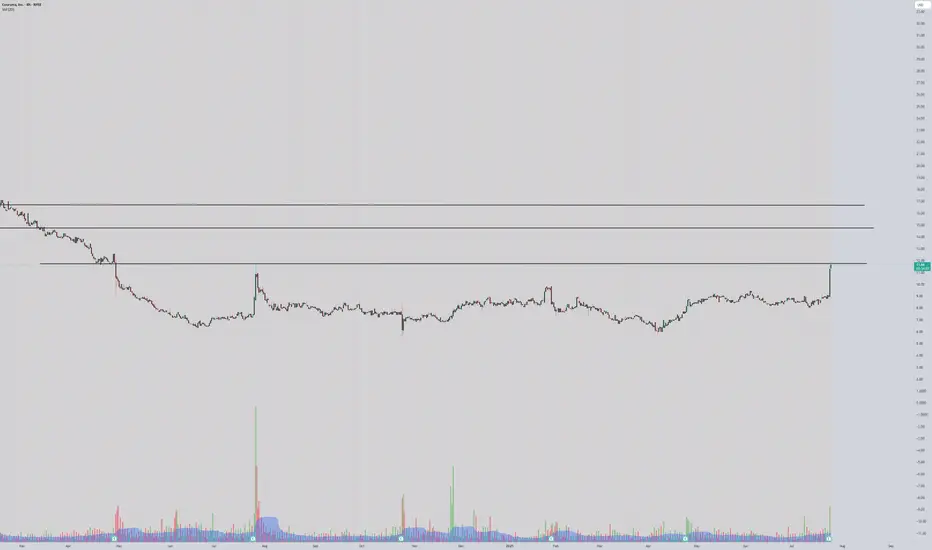
$COUR long at $5.80?Coursera has been correcting ever since it IPOed. It hit a high of $60 and now it's declined nearly 90%.
Based on the chart, it looks like the downtrend should be ending soon. I'd like to see backtest of that trend line break at around $5.80 and a push higher to start the new bull trend.
Think we'

COUR trend reversalI was hoping to get a dip down to $13.50 level but it broke the downtrend line and RSI curling after FOMC . Took a starter. Will add over 9EMA break

COUR 4 HOUR LONGCOUR is currently in the expansion phase (contraction, expansion, trend phase) and is on -2 SD extremes.
TP: 20.96
SL: 16.50

Navigating the Crossroads: Coursera's Market ChallengeCoursera (NYSE: NYSE:COUR ) has found itself at a crossroads in the ever-evolving landscape of the education technology industry. A significant market decline ensued after Goldman Sachs analyst Eric Sheridan downgraded the company, expressing concerns about the potential impact of generative AI tec

(NYSE: COUR) Why Coursera Inc's Stock SkyrocketedFundamentals
Coursera Inc (COUR, Financial), a leading player in the education industry, has seen a significant surge in its stock price over the past three months. With a current market cap of $2.8 billion and a stock price of $18.35, the company's stock price has seen a gain of 11.47% over the pa

Coursera Inc. Bullish Trend Price Momentum
COUR is trading near the top of its 52-week range and above its 200-day simple moving average.
Price change
The price of COUR shares has increased $0.74 since the market last closed. This is a 4.30% rise.
Opened at $17.47.
The stock opened $0.27 higher than its previous close.
Inves

$COUR, you will never sell the highI took a decent profit form this trade
Now, this bearish divergence is signaling that it may need more time to form a new base to continue its uptrend
I will be watching this one as is still outperforming.

See all ideas
Summarizing what the indicators are suggesting.
Oscillators
Neutral
SellBuy
Strong sellStrong buy
Strong sellSellNeutralBuyStrong buy
Oscillators
Neutral
SellBuy
Strong sellStrong buy
Strong sellSellNeutralBuyStrong buy
Summary
Neutral
SellBuy
Strong sellStrong buy
Strong sellSellNeutralBuyStrong buy
Summary
Neutral
SellBuy
Strong sellStrong buy
Strong sellSellNeutralBuyStrong buy
Summary
Neutral
SellBuy
Strong sellStrong buy
Strong sellSellNeutralBuyStrong buy
Moving Averages
Neutral
SellBuy
Strong sellStrong buy
Strong sellSellNeutralBuyStrong buy
Moving Averages
Neutral
SellBuy
Strong sellStrong buy
Strong sellSellNeutralBuyStrong buy
Displays a symbol's price movements over previous years to identify recurring trends.
Curated watchlists where C2OU34 is featured.

