CZR SwingThere is a cup and handle forming on the 1 hour, along with both the 20 and 50 EMAs crossing above the 200, indicating a strong reversal. If this breaks and closes above support, could run to 100 end of next week and make a similar move as MGM did.
C2ZR34 trade ideas

CZR, Aroon Indicator entered an Uptrend on January 12, 2021.Over the last three days, Tickeron's A.I.dvisor has detected that CZR's AroonUp green line (see chart) is above 70, while the AroonDown red line is below 30. When the green line goes above 70 while the red line stays below 30, this is an indicator that the stock could be poised for a strong Uptrend. For traders, this could mean going long the stock or exploring call options in the next month. Tickeron's A.I.dvisor backtested this indicator and found 327 similar cases, 283 of which were successful. Based on this data, the odds of success are 87%. Current price $76.65 is above $74.27 the highest resistance line found by Tickeron A.I. Throughout the month of 12/09/20 - 01/12/21, the price experienced a +10% Uptrend. During the week of 01/05/21 - 01/12/21, the stock enjoyed a +6% Uptrend growth.
Bullish Trend Analysis
The Momentum Indicator moved above the 0 level on January 06, 2021. You may want to consider a long position or call options on CZR as a result. Tickeron A.I. detected that in 65 of 81 past instances where the momentum indicator moved above 0, the stock continued to climb. The odds of a continued upward trend are 80%.
The Moving Average Convergence Divergence (MACD) for CZR just turned positive on January 12, 2021. Looking at past instances where CZR's MACD turned positive, the stock continued to rise, Tickeron A.I. shows that in 35 of 46 cases over the following month. The odds of a continued upward trend are 76%.
CZR moved above its 50-day Moving Average on November 05, 2020 date and that indicates a change from a downward trend to an upward trend.
The 50-day Moving Average for CZR moved above the 200-day moving average on September 09, 2020. This could be a long-term bullish signal for the stock as the stock shifts to an upward trend.
Following a +3.36% 3-day Advance, the price is estimated to grow further. Considering data from situations where CZR advanced for three days, in 291 of 358 cases, the price rose further within the following month. The odds of a continued upward trend are 81%.
The Aroon Indicator entered an Uptrend today. Tickeron A.I. detected that in 283 of 327 cases where CZR Aroon's Indicator entered an Uptrend, the price rose further within the following month. The odds of a continued Uptrend are 87%.

CZR - Short Setup Looking for a break below 70.83. Would consider stop at 75.79. First target 61.53, Second Target Momentum. Could consider June $70 Puts

Reminder to check in March '21looking for a potential 3 rising valleys. Previous 2 valleys were 4 months apart, so that is why I'm looking at March entry.

Break Up the resistance with High Volume We have an ascending Triangle with high volume breaking up we will see a gap or uptrend next week toward 16-17

CAESARS ENTERTAINMENT Estimates DailyHey traders, CAESARS ENTERTAINMENT is in an uptrend with shadow of sellers and low buying volume being done. Leaning over the TIMEFRAME M1 we can see a bull headstone with a low purchase volume as it goes on its next low. Then return to its price breakout it is plausible to break the VWAP in force to climb to the next high. And if the buyers are still in agreements we can go up after entering a resistance (See TIMEFRAME H4).
Please LIKE & FOLLOW, thank you!

czr potential outcomesi tend to be bullish because of the overall trend however i am neutral positionwise


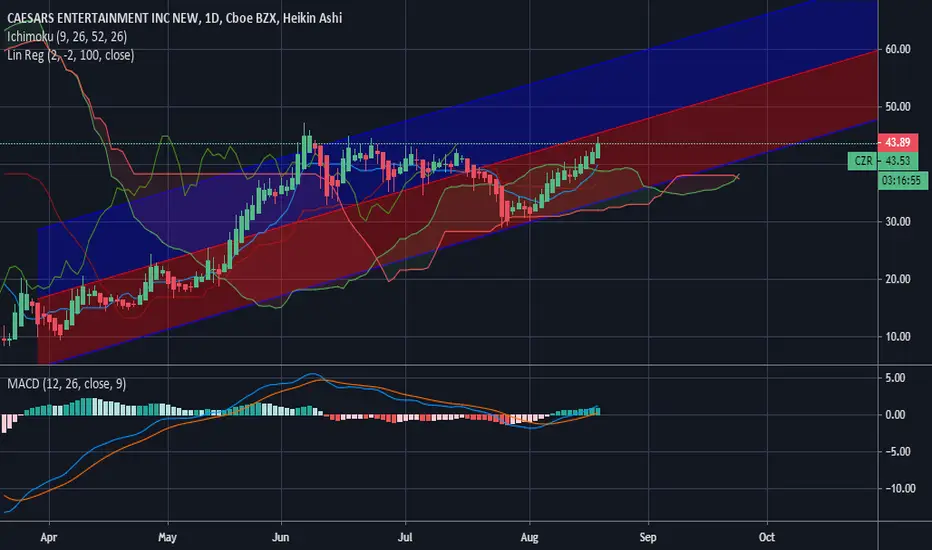
I love this chart - Trend channelPrice follows trend channel with the exception of a couple of breakouts. Caesar's will do well as Vegas opens up more and gambling revenues increase.

DKNG Channel - I love this chartPrice follows consistent trend channel with a couple of breakout exceptions. Caesar's is a key company to watch as Vegas continues reopening progress and gambling revenues increase.

CZR Broadening Wedge Ascending (bullish)I found this pattern at tickeron website with the following data:
STATUS = Confirmed
CURRENT CONFIDENCE = 82%
TARGET (EXIT) PRICE = 66.92 USD
BREAKOUT (ENTRY) PRICE = 55.37 USD
DISTANCE TO TARGET PRICE = 23.83%
EMERGED ON = Sep 14, 12:00 PM (EDT)
CONFIRMED ON = Sep 14, 03:56 PM (EDT)
WITH CONFIDENCE LEVEL = 99%
Once the price breaks out from the top pattern boundary, day traders and swing traders should trade with an UP trend. Consider buying a security or a call option at the upward breakout price/entry point. To identify an exit, compute the target price for this formation by adding the height of the pattern to the upward breakout level. Pattern height is the difference between the breakout price (the highest high within the pattern) and the highest low.
To limit potential loss when the price suddenly goes in the wrong direction, consider placing a stop order to sell at or below the breakout price.
The Broadening Wedge Ascending pattern forms when the price of a security progressively makes higher highs (1, 3) and higher lows (2, 4), following two widening trend lines. This pattern may form when large investors spread their buying over a period of time.
The theory goes that after initial buying occurs, other market participants react to the rising price and jump on the bandwagon to participate. Then value investors begin to sell, believing the price has risen too much, which spurs the original large investor to resume buying again. Once these activities stop, the price may break out in either direction.

CZR long signal. SL close below pink zone. TP in green zone.CZR long signal. SL close below pink zone. TP in green zone.

CZR:NASDAQ - CAESARS ENTERTAINMENT - Up 600% since March lowsCaesars is making a nice comeback. Less volatility in the last few weeks and didn't get hit by last weeks correction. Could be worth a watch.

$CZR Caesars Entertainment Bull-Flag Breakout
Bullish Break above the 200ma from a possible Bull-Flag
RSI has room to run and upward trajectory.
Potential resistance is strongest at the $46.- $48
level at the Fibonacci Golden pocket .
Volatile sector with its COVID exposure.

Sell the news. MergerRecent merger sent this ponzi from 12$ to 33$ per share, but didn't let investors make profits from this merger. They not gonna love it. Also 2nd wave of corona will bring Casinos to next lows in my opinion.

Eldorado Resorts and Caesars Entertainment Complete MergerEldorado Resorts and Caesars Entertainment Complete Merger
-making us the premier leader in gaming and hospitality.
www.prnewswire.com

possible trend CZRred are the down trends and green are all the possible trends in the past Blue is where i think the market is going what you guys think looks like a good long term call to me

CZR was a top quarterly gainer. Expect an Uptrend continuationA buy signal is generated. I analyzed 20 stocks in the Casinos/Gaming Industry over the last three months and discovered that 19 of them (94.12%) charted an Uptrend while 1 of them (5.88%) trended down. I found 306 similar cases when CZR's price jumped over 15% within three months. In 190 out of those 306 cases, CZR's price went up during the following month. Based on these historical data, I think the odds of an Uptrend continuation for CZR are 62%.

CZR ? - Questions for my powerful, smart menCurrently working on small coding project. An algorithm that filters stocks from the TSX, TSX Ventures and CSE who’s price closes below the lower Bollinger band (80). I’ve been reading some of the work from Matt at Trader University and he calls it the rubber band stocks. Even though the purpose of this project is merely recreational, it got me thinking of a few questions I need answers to. Please feel free to comment and leave your thoughts. I like learning from the experienced day traders out there.
1) what time period should i use if i want to shorten the time i hold the stock? I find that with the 80 day bolllinger, if the stock closes below the lower band, It usually takes around 4 to 7 days for it to bounce back to the middle band. My goal is to reduce my holding period for a maximum of 3 days.
2) the goal of the algorithm is to filter stocks that are being oversold in order to have enough room for the price to bounce back at least 1% per trade. Is this an unrealistic goal? My reasoning behind it: get a 1% weekly return, which annualized is around 56% when compounded without much risk involved.
3) do the experienced day traders out there even follow a certain strategy? Or do you guys make your trades based on other research?? If you follow a strategy, may a please have the name to research more about it
4) do the experienced day traders place stop loss orders? I’ve noticed that the algorithms from the institutional investors pick up on those orders just to fill them up and trade the stock up again.
5) if you use stop loss orders, what’s the level of risk you put into every trade? Even if you don’t actually set up a stop loss order, what’s the level of risk you are comfortable with before deciding to exit the trade at a loss?
To my all my powerful and smart men reading this, please help this girl out with some answers. Please leave a comment or thought you think will help me :)


CZR! Rising Channel!
CZR
My Thoughts!
Current Price: 11.76
Divergence: Bullish
Daily Pattern: Rising Channel
Possible Pattern: N/A
Current Resistance: 12.33
Current Support: 11.21
Targets are take profit areas for me!
BearishTargets: (Support)
1) 11.21
2) 10.79 (Rising Channel Support) Bullish
4) 9.96 (Crucial Support Level) Bearish
5) 8.77
Bullish Targets: Only if Resistance Breaks!
Must break Current Resistance: 12.33
1) 12.33
2) 13.48
3) 14.77
4) 17.21
Please remember to DYOR and this is not financial or investment advice. It's my targets for the market at this moment. Please let me know what you think of my technical analysis and thank you.
