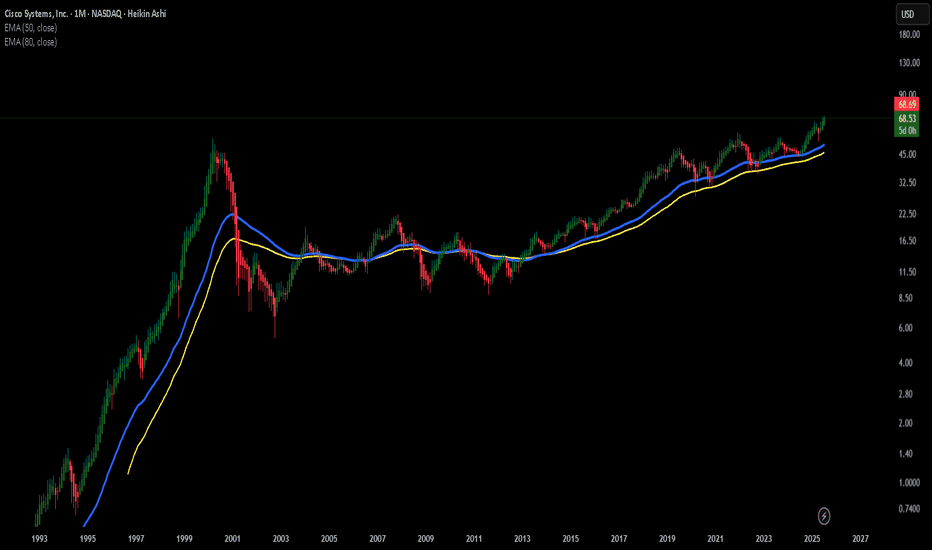
CSCO – Cisco’s Not Done Dancing Yet!
When I look at CSCO, I get the feeling that this old-school tech legend still has some rhythm left in its step. It’s like that uncle at the family wedding who’s been around the block but somehow still manages to pull off a surprisingly smooth move on the dance floor.
It may not be the flashiest st
27,171.43
0.00 BRL
52.27 B BRL
272.53 B BRL
About Cisco Systems, Inc.
Sector
Industry
CEO
Charles H. Robbins
Website
Headquarters
San Jose
Founded
1984
ISIN
BRCSCOBDR004
FIGI
BBG0019P20W4
Cisco Systems, Inc. engages in the design, manufacture, and sale of Internet Protocol-based networking products and services related to the communications and information technology industry. The firm operates through the following geographical segments: the Americas, EMEA, and APJC. Its products include the following categories: Secure, Agile Networks, Internet for the Future, Collaboration, End-to-End Security, Optimized Application Experiences, and Other Products. The company was founded by Sandra Lerner and Leonard Bosack in 1984 and is headquartered in San Jose, CA.
Related stocks
3 Reasons Why Cisco Stock Is Ready to Rocket (Bonus Strategy)3 Reasons Why Cisco Stock Is Ready to Rocket (Bonus Strategy Inside)
Cisco is flashing bullish signs from candlesticks to volume. Here's why a breakout could be imminent — with a bonus momentum strategy revealed.
---
Cisco Systems ( NASDAQ:CSCO ) is showing signs of a potential breakout — and sav
CSCO Long CallsCisco's uptrend exceeded previous highs and heading toward 127% extension from the 4/9 Tariff lows.
Prices are currently consolidating between $68 and $70 with a volume level.
I am buying in the lower 1/2 - 1/4 of the range with an expectation of a move back to the $70 level and beyond.
August 15
CSCOThe CSCO stock is very promising for investors, with excellent indicators. It has formed a symmetrical triangle on the weekly chart, which has been strongly broken out of after a significant accumulation phase at $55.95. Currently, we are at a resistance zone where we expect a correction. There are
Cybersecurity Strength Makes It a Stable Long-Term Bet Targets:
- T1 = $68.31
- T2 = $72.05
Stop Levels:
- S1 = $64.34
- S2 = $59.69
**Wisdom of Professional Traders:**
This analysis synthesizes insights from thousands of professional traders and market experts, leveraging collective intelligence to identify high-probability trade setups
Cisco Is Pushing a Generational HighCisco Systems has climbed as AI investment helps power growth, and some traders may think the move will continue.
The first pattern on today’s chart is the February 13 peak of $66.50. It was the highest level since September 2000, when the dotcom bubble was deflating. The networking giant come with
What Fuels Cisco's Quiet AI Domination?Cisco Systems, a long-standing titan in networking infrastructure, is experiencing a significant resurgence, largely driven by a pragmatic and highly effective approach to artificial intelligence. Unlike many enterprises chasing broad AI initiatives, Cisco focuses on solving "boring" yet critical cu
Cisco’s Charts Are Painting a Conflicting PictureCisco Systems NASDAQ:CSCO lost some ground in recent days even as the tech giant kicked off its Cisco Live 2025 event this week in San Diego, and the stock’s charts are flashing some conflicting signals. Let’s take a look.
Cisco’s Fundamental Analysis
CSCO’s three-day Cisco Live event began Mo
Cisco Wave Analysis – 11 June 2025
- Cisco reversed from the key resistance level 65.60
- Likely to fall to support level 62.20
Cisco recently reversed down from the key resistance level 65.60 (which has been reversing the price from the start of February).
The downward reversal from the resistance level 65.60 created the daily J
See all ideas
Summarizing what the indicators are suggesting.
Oscillators
Neutral
SellBuy
Strong sellStrong buy
Strong sellSellNeutralBuyStrong buy
Oscillators
Neutral
SellBuy
Strong sellStrong buy
Strong sellSellNeutralBuyStrong buy
Summary
Neutral
SellBuy
Strong sellStrong buy
Strong sellSellNeutralBuyStrong buy
Summary
Neutral
SellBuy
Strong sellStrong buy
Strong sellSellNeutralBuyStrong buy
Summary
Neutral
SellBuy
Strong sellStrong buy
Strong sellSellNeutralBuyStrong buy
Moving Averages
Neutral
SellBuy
Strong sellStrong buy
Strong sellSellNeutralBuyStrong buy
Moving Averages
Neutral
SellBuy
Strong sellStrong buy
Strong sellSellNeutralBuyStrong buy
Displays a symbol's price movements over previous years to identify recurring trends.
Curated watchlists where CSCO34 is featured.


