CSX Earnings New MGTWe may see increased earnings under the new MGT. We are looking at a Possible Strong Buy Signal in the morning. No turkey stamp of approval.
CSXC34 trade ideas

CSX Potential LongLow IV, still disconnected analyst ratings and earnings not until near the end of the month. Why not?

CSX Overbought on the Daily. CSXPossibly completing Wave A of something bigger. Deductively this leaves us with many scenarios, and we are speculating that a zigzag or a ABCDE is next, we cannot possibly tell from this standpoint. In either case a significant overbought on the daily leaves chances for a reversal and a bearish scenario to follow.
We are not in the business of getting every prediction right, no one ever does and that is not the aim of the game. The Fibonacci targets are highlighted in purple with invalidation in red. Confirmation level, where relevant, is a pink dotted, finite line. Fibonacci goals, it is prudent to suggest, are nothing more than mere fractally evident and therefore statistically likely levels that the market will go to. Having said that, the market will always do what it wants and always has a mind of its own. Therefore, none of this is financial advice, so do your own research and rely only on your own analysis. Trading is a true one man sport. Good luck out there and stay safe.

CSX $34 Resistance Level- CSX trading right at resistance level of $34
- 61.8 fib (March 2022 high to July 2022 low) $34~

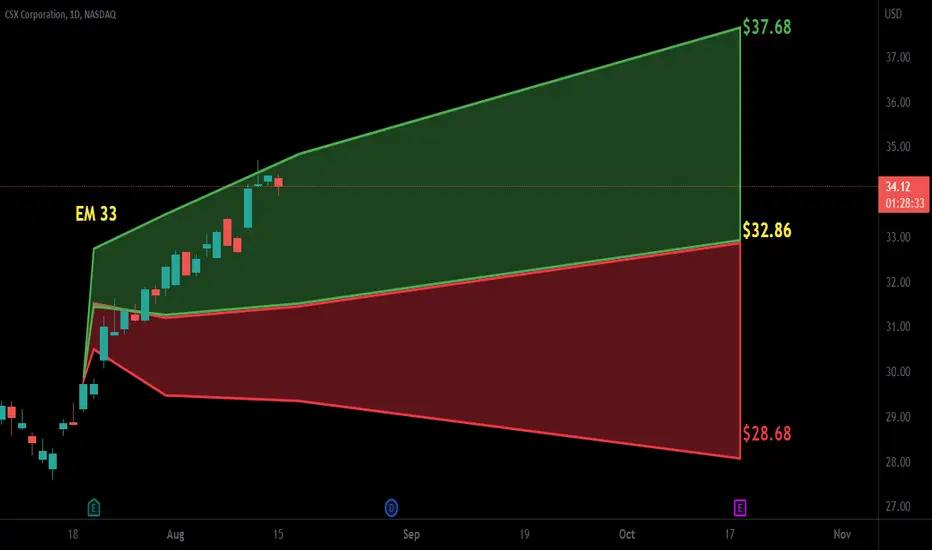
$CSX with a Bullsh outlook following its earnings #Stocks The PEAD projected a Bullish outlook for $CSX after a Positive Under reaction following its earnings release placing the stock in drift A with an expected accuracy of 66.67%.
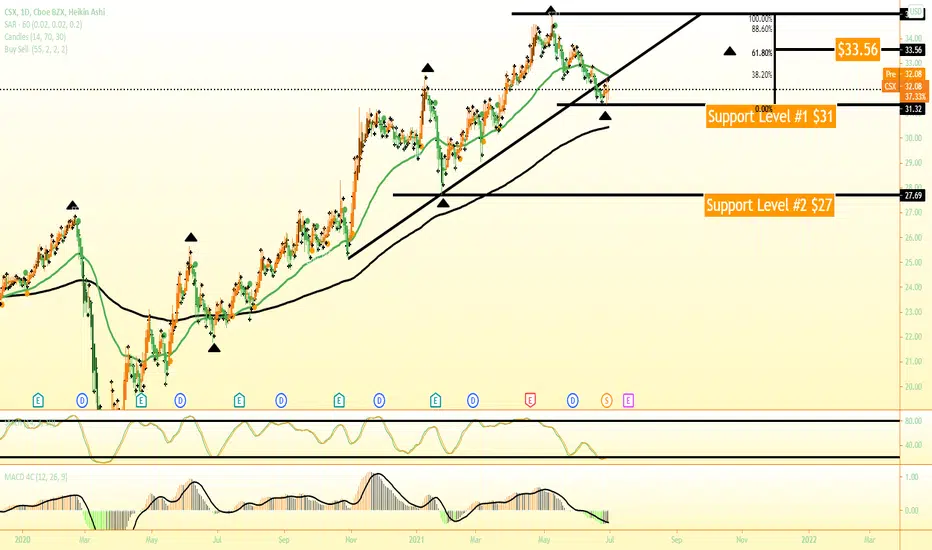
CSX Continuation LikelyPlaying with hypotheticals regarding the breakdown of the large trendline that extends from the year 2000. It is very strong.
If price breaks down it is currently supported by the 4.618 fib
however this is just speculation, it is a lot more likely that continuation of the uptrend will result
Areas in red are very similar rejection points

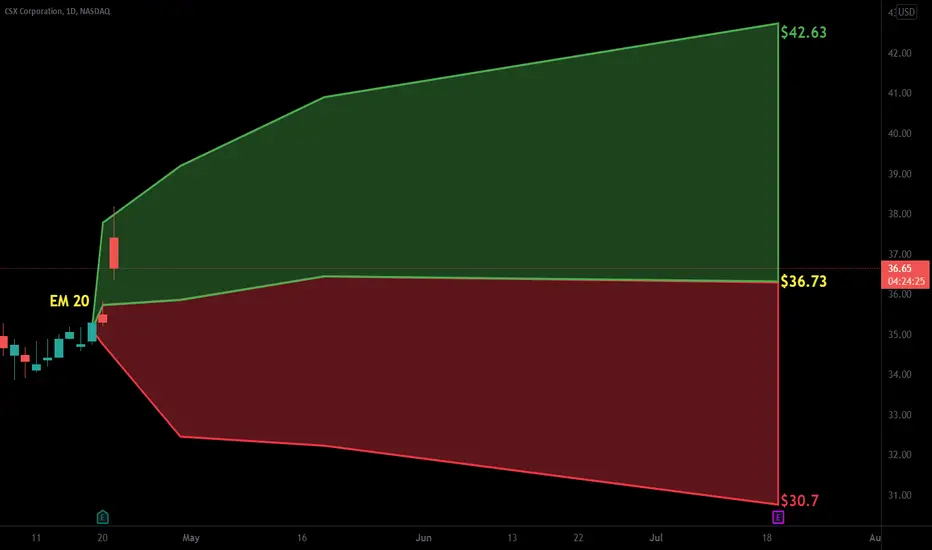
$CSX with a Bullish outlook following its earnings #Stocks The PEAD projected a Bullish outlook for $CSX after a Positive over reaction following its earnings release placing the stock in drift B with an expected accuracy of 72.73%.
CSX DEC ASC WEDGE CSX Buy And Hold Accumulate. Continue to buy the wave and hold. Long term outlook is trending up. Big Bounce Up on the horizon.

Possible Trend Reversal Swing TradeCSX looks to have found the support
It has close and broken the short downtrend
Went Long at 25.01
Stop Loss be placed below previous Pivot Low

STRONG UPWARD CHANNEL IS PRESENTupward moving channel with good volume strikes me as a long term trend in transportation equities.

CSX Post EarningsI like this level on NASDAQ:CSX for a long to retest the Major Highs. It is the 50% Retracement since the September low and the bottom of the Daily Ichimoku cloud. it is post earnings and IV has returned to average I am using the May24 37.5 Calls to express the trade.

CSX Shake Up ComingNew Leadership Will Triple Stock Price. Accumulate. Changes on the horizon keep it on the down low they don`t know yet. Price may fall more prior to changes just keep buying all dips. Will take about 1.5 years to complete new mgt may accelerate to 6 months. ; )

CSX broke out of a tight range. Where is it headed next?* Great earnings
* Very strong up trend
* High 3-month relative strength in the Industrial sector
* Built an 8 month base between $29.71 and $34.26
* After breaking out it started to consolidate in a tight range creating a base on base pattern
* Breaking out of the range with higher than average volume
Trade Idea:
* Now's a great time to enter as the price is very close to the broken level
Caution:
* A daily close below $36.25 would put the price back inside the range and expose $35.14 as support
* Consider exiting the trade early if the price make 4 consecutive lower lows on a daily basis.
* Alternatively, a daily close below $35.14 would negate the idea

If it can break 26.2 then buyIF the stock can break resist 26.2 dollar then buy . This is my recommend

CSXNice looking flag set up on csx chart maybe put a buy stop on it to get in on a breakout . Its currently sitting on the 50day ema support on the 4hr chart If you go down to a shorter time frame of 1 hr the 200 ema is around 34.70 and is at the bottom of the flag trend line support and it would also pretty much close that prior gap up So in my opinion its something worth keeping a eye on

CSXIt looks like we are currently at a high that has broken the previous high since August 23rd. I want to wait until price gets closer to my 20 (red) and 50 (orange) ema's It seems as if we started trading above the 200 ema after we had bearish candles that broke under temporarily where it reached and rejected a strong support level of around $29. Between Dec 2020 and May 2021, there is some heavy traffic on the railway. I would like the current price to retrace its previous low from Sept 27th up to at least 38% - 61% with some bullish candles and price action on the 15 min timeframe to see if we are ready for a ride up if CSX does actually drop. Best case scenario, I want price to bounce off of the 38% daily Fibonacci level to continue towards the upside (creating a lower high). None of my words are law. Just an idea! Oh....I'm tired of getting stopped by trains and I always see a CSX train everytime smh.

#CSXcorporation interesting red candle on resistance www.tradingview.com
NASDAQ:CSX
Beautiful red candle on resistance.
Per-market and opening to check tomorrow to enter on short position or not.

CSX 4th top to heads up, resistance contactwww.tradingview.com
RSI overbought on daily chart.
Price make contact with resistance area for the 4th time,
Volume seams great so far to expect a breakout anytime soon.
Buying signal must be consider before taking any position.
In case of a short position fibo 0.5 is a good option, as usual.