CTGP34 trade ideas

Relative weakness in US BanksBanks mostly soared higher in Q2 (excluding Wells Fargo), although the last few weeks have seen weakness...

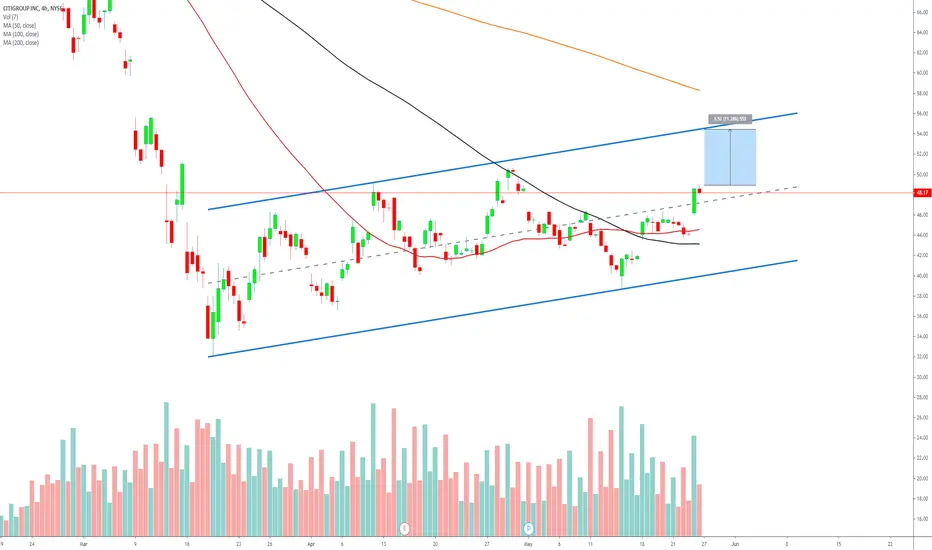
$C Citigroup Pennant Breakdown - Bearish Options Activity$C Citigroup Pennant Breakdown - Bearish Options Activity
$8M bearish options bet on $55.00 strike Jan 2022 puts traded yesterday.
Expecting this to breakdown further leading into earnings mid-July.
See chart for possible near term targets.
Note: Not investment advice.


C - swing calls, RSI and 20sma support callsGreen rectangle shows where price touched 20sma and is moving back up. Yellow rectangle shows where RSI retraced below 50 and is now back over.
20sma is almost out of cloud on daily chart. 10sma is greater than 20sma, with upward slope.


$C Citigroup Inc Trade Setup
Stock has broken out from channel and previous target blown through
Next reasonable target to watch is the Gap fill and then daily resistance at $62

CITIGROUP INC Elliott Perspective on Daily ChartDo not ever Forget the content on all of our analysis are subject to change at any time without notice, and is provided for the sole purpose of assisting traders to make independent investment decisions.
Please support us to help more people..

$C Citigroup channel trade
Looking for some continuation tomorrow after a very impressive move today.
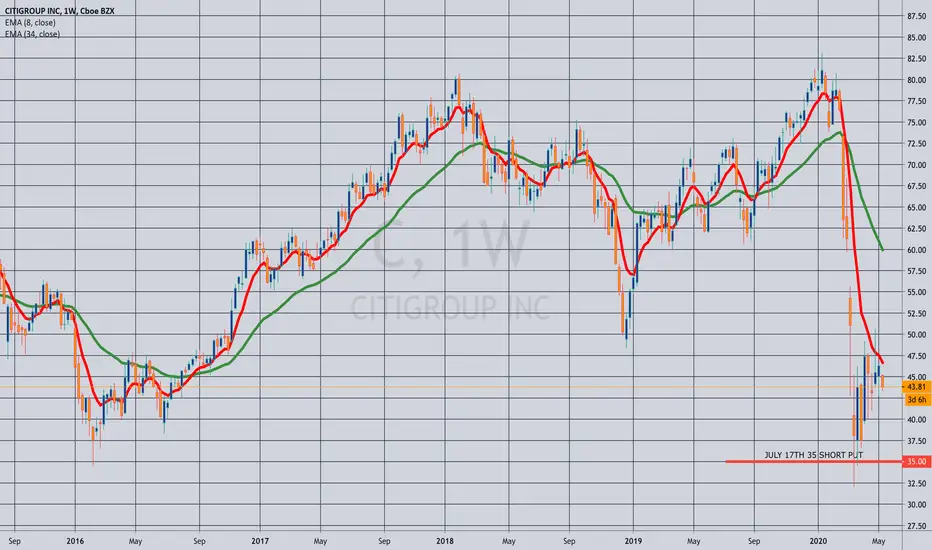
OPENING: C JULY 17TH 35 SHORT PUT... for a 1.22/contract credit.
Notes: Taking a small directional shot here in relatively high implied for a financial (42/53) that's been #CoronaHammered. Would also be fine with taking on shares and then proceeding to cover with a cost basis of 33.78, since it has dividends (4.4% yield).

C exhaustion gap pullback long opportunityC has a textbook-like exhaustion gap,
to look for some pullback long opportunity will interest me a lot.
Let's see how it goes yo!


Real Simple Sell hereClear Bear Flag bolstered by general XLF weakness. Not looking to accumulate shares yet as the stock remains in a bear market with likely more market selling pressure joining as the flag breaks.


CCITIGROUP INC
Potential Profit: ~5% based on Resistance level of $46.52
Potential Profit 2: ~15.77% based on resistance of $51.18
Support Level: $42.62
To enter the 5% profit area:
RSI: Oversold in the 1 Month
MACD: It is currently towards up in the 1 Month
I would say this is a good entry point(currently $44.07) if you are looking to get a high percentage 5% profit.
To enter potential profit 2 I would take profits at close to resistance of $46.52.
Watch if it breaks above $46.52 and then confirm if $46.52 validates as the new support level and then decide if you would like to participate in the 16% upside, just note that this is a bank and is affected heavily by fundamentals and overall economy, so the 16% upside has a lower chance of reoccurring but it is
not impossible to happen since it happened around April 29.


C calls set to expire on Friday (5/8/2020)I think C could make a move up to 50 or above this week. I saw some really cheap calls on C this afternoon just before market close. At a 0.03 premium, I picked up call contracts for the 52 strike set to expire 8 May 2020.
I'll be looking to sell the contracts if price makes a move to 50 or above.
I'm risking less than 1% (0.0935%) of my account balance.

C - watch yellow line - swing calls or putsHere on the daily chart you can easily see the case for put options if stock closes below yellow line. There is one lower support on a line chart (dashed line connecting closing prices). For the bigger picture, see a long term monthly chart.
Citigroup stock can head down to 30, up to 60. Keep watch on the daily RSI. Right now indicators are leaning towards puts.

CITIGROUP (C) IN A CLASSIC FLAG FORMATION
after a strong bearish wave, we see a steady recovery on CITI.
the price is steadily going up within a rising parallel channel called a bearish flag pattern.
its called bearish because even if the sentiment is locally bullish, on a long run stock is falling and we keep our bearish bias.
we don't know how long the price will be within, the only trigger for us is the breakout.
daily candle close below is the perfect signal to look for a short trade, expecting a continuation to current structure low
with a potential rally to the downside!
keep watching citi and try to catch a perfect swing short!
good luck!

NYSE:CitibankI don't like this 174 weeks double top pattern. Last week's closing had it retested the neckline but failed to turn resistance into support. Proceed with caution. I have a short target of $18 in future.
Anything above $50.60 invalidates this view.

$C Citigroup very bullish session
Upside target to the 50 day moving average and historical resistance.
Sector is benefiting from some rotation out of big tech.
PLEASE DROP US A LIKE IF YOU FIND THIS HELPFUL, THANKS
