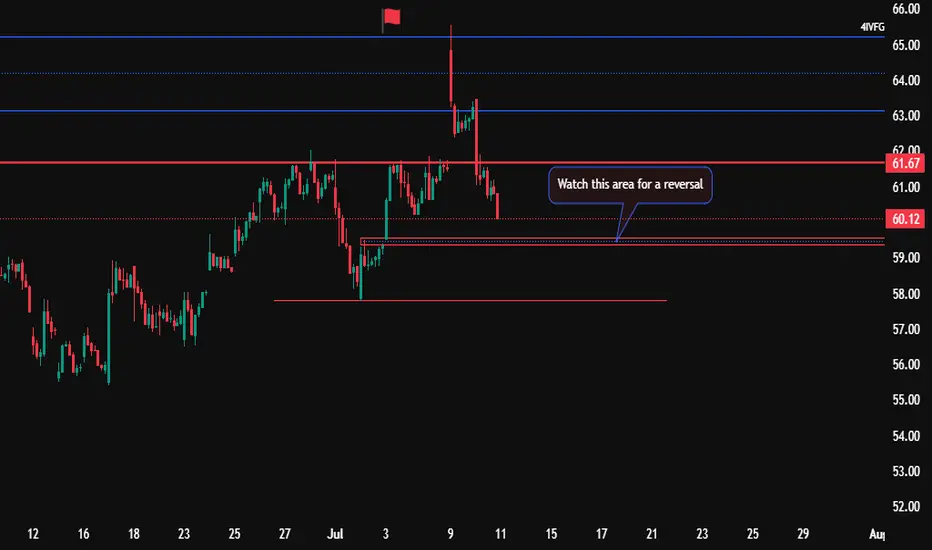
DOCS Potential ReversalWatching DOCS finally broke through 61 ish, coming back to fill the gap around 59.50.
Once it gets there and it will. Be waiting on my reversal pattern on lower time frame. Take 1-1 on the lower tfs. See if it breaks above or wants to go lower. Tight SLS until reversal confirmed on the 15. Take you
55,200.000
0.001 BRL
1.25 B BRL
3.20 B BRL
About Doximity, Inc.
Sector
Industry
CEO
Jeffrey A. Tangney
Website
Headquarters
San Francisco
Founded
2010
ISIN
BRD2OCBDR005
FIGI
BBG014XJBVJ1
Doximity, Inc. engages in the development and operation of an online platform for medical professionals. Its cloud-based software has the ability to enable users to collaborate with their colleagues, coordinate patient care, conduct virtual patient visits, stay up to date with the latest medical news and research, and manage their careers. The company was founded by Shari Buck, Konstantin Guericke, Nate Gross, and Jeffrey A. Tangney on April 16, 2010 and is headquartered in San Francisco, CA.
Related stocks
Bullish opportunity after reaction from 10 and 20 EMAAnother opportunity I'm tracking is with Doximity (DOCS)—a trade I’m already involved in. I’ve been gradually scaling in more capital, as the price action continues to offer favorable entries that align with my strategy.
The stock recently broke out of a long-standing descending channel, and that b

DOCS huge base breakout with very strong momentum NYSE:DOCS
DOCS huge base breakout with very strong momentum
Good volumes too.

Breaking: Doximity Stock Jumps 37% On Upbeat Annual OutlookDoximity Inc. (NASDAQ: DOCS), the leading digital platform for U.S. medical professionals, has made headlines with its stock skyrocketing 37% following a stellar earnings report and an upbeat annual outlook. The company’s third-quarter fiscal 2025 results not only surpassed analyst expectations but

Doximity Is Preparing To Report Another Strong QuarterKey arguments supporting the idea
• Doximity is a leader in the rapidly growing telemedicine industry.
• The results for Q3 FY2025 may once again impress investors due to the use
of AI tools.
• Maintaining high growth rates of financial indicators and a strong balance
sheet in the medium term.

New Setup: DOCSDOCS : I have a swing trade setup signal. I'm looking to enter long if the stock can manage to CLOSE above the last candle high(BUY). If triggered, I will then place a stop-loss below (SL) and a price target above it(TP-50%,move SL to breakeven), then using the close below the 10SMA as my trailing s

Betting on $DOCS: A Technical Analysis Forecasting 8% GrowthNYSE:DOCS shows strong performance with a Relative Strength (RS) rating of 98. The On-Balance Volume (OBV) has been rising since October 1st, indicating ongoing buying interest. The stock is forming a bullish base along the trend line, supported by the 10-day and 20-day Exponential Moving Averages

New Setup: DOCSDOCS: I have a green setup signal(dot Indictor). It has an excellent risk-to-reward ratio(RR:). I'm looking to enter long near the close of the day if the stock can manage to CLOSE above the last candle highs(white line). If triggered, I will then place a stop-loss below(SL) and a price target above

DOCS Doximity Options Ahead of EarningsIf you haven`t bought DOCS before the previous earnings:
Then analyzing the options chain and the chart patterns of DOCS Doximity prior to the earnings report this week,
I would consider purchasing the 25usd strike price Calls with
an expiration date of 2024-6-21,
for a premium of approximately $1

Doximity Surges 18% on Earnings Beat and Strong OutlookDoximity shares ( NYSE:DOCS ) surged 18% after the company beat quarterly earnings forecasts, provided a better-than-expected current-quarter outlook, and unveiled a share buyback program. The provider of curated medical news and telehealth tools reported adjusted earnings of 25 cents per share for

See all ideas
Summarizing what the indicators are suggesting.
Oscillators
Neutral
SellBuy
Strong sellStrong buy
Strong sellSellNeutralBuyStrong buy
Oscillators
Neutral
SellBuy
Strong sellStrong buy
Strong sellSellNeutralBuyStrong buy
Summary
Neutral
SellBuy
Strong sellStrong buy
Strong sellSellNeutralBuyStrong buy
Summary
Neutral
SellBuy
Strong sellStrong buy
Strong sellSellNeutralBuyStrong buy
Summary
Neutral
SellBuy
Strong sellStrong buy
Strong sellSellNeutralBuyStrong buy
Moving Averages
Neutral
SellBuy
Strong sellStrong buy
Strong sellSellNeutralBuyStrong buy
Moving Averages
Neutral
SellBuy
Strong sellStrong buy
Strong sellSellNeutralBuyStrong buy
Displays a symbol's price movements over previous years to identify recurring trends.