DAX 30 average stock drawdown ...DAX 30 average stock drawdown ... UPDATED Tickers 3 indicators, time can be ajusted
DAX1! trade ideas

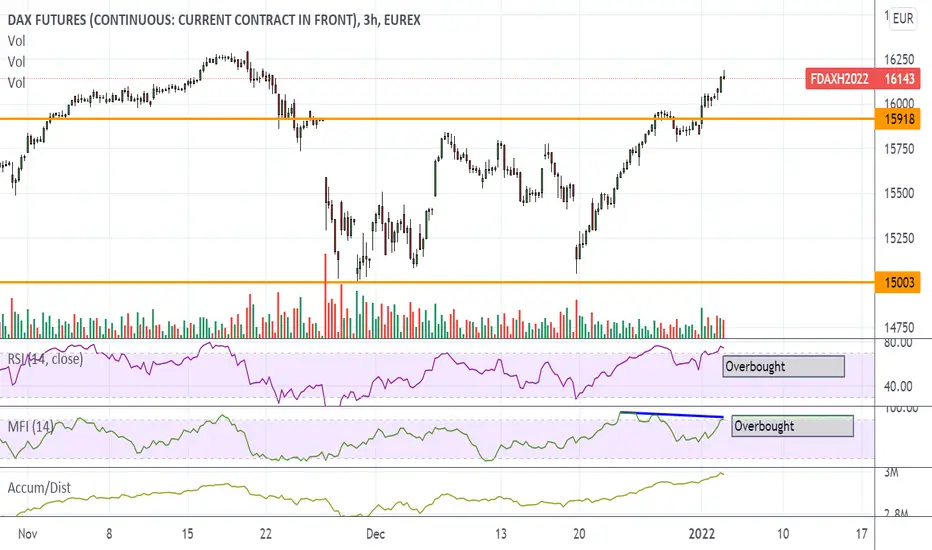
FDAX UpdatePotential gap down tomorrow because FDAX MFI hit oversold and turned around.
If you're still bullish wait until at least tomorrow to buy the dip. Stay away from garbage small cap stocks. Big tech is about the only thing I'm bullish on. If a company didn't go up on earnings, it ain't gonna go up when interest rates rise.
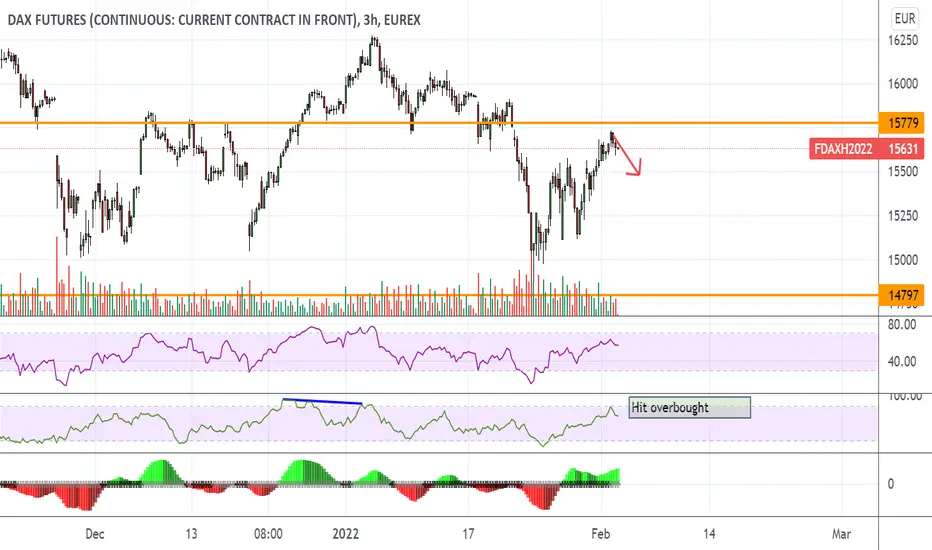
FDAX UpdateI don't think we see a drop until FDAX gets overbought. Could happen as soon as tomorrow, so will keep an eye on this for you guys

DAX: Eye of the Tiger 🥊🥊 Dam damdamdam damdamdam damdamdaaam
Dam damdamdam damdamdam damdamdaaam
“Rising up, back on the street,
Did my time, took my chances,
Went the distance, now I’m back on my feet,
Just a man and his will to survive”
The Survivor-song seems to be playing in the background, while DAX is battling its way back to the resistance at 15711 points. Like Silvester Stallone in “Rocky III”, the index is striving for a comeback above 15711 points and higher still. We expect its ambitions to be successful. The index should ascend until 16295 points to finish wave i in orange. Then, after a short countermovement back to about 15711 points, a long-term rise above 16295 points should follow.
If the workout is too tough, though, there is a 35% chance that DAX could make a detour. If it falls below 14795 points, the index could initially descend into the magenta zone between 14392 and 13805 points before starting its comeback in earnest. It should then zoom above 14795 points again, from where its power should suffice to aim for higher goals.

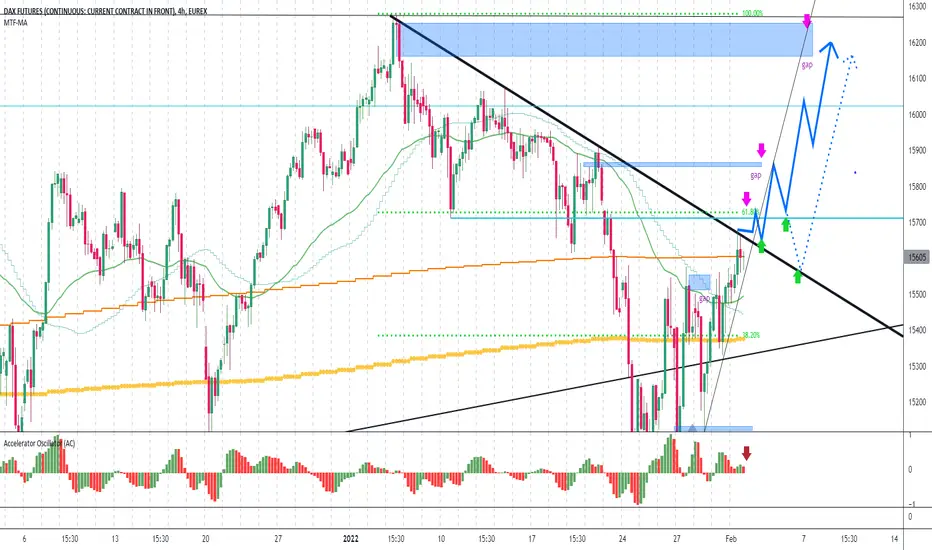
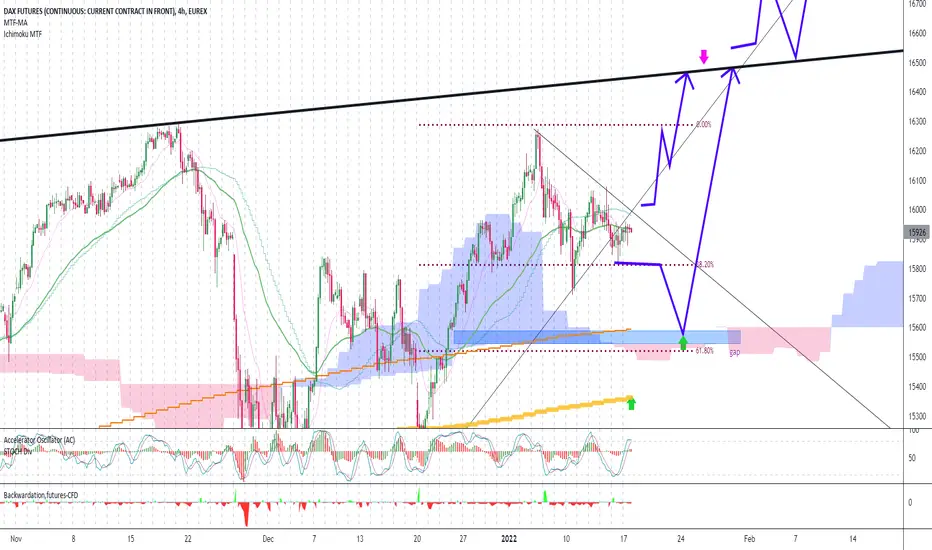
dax going fill upper gaps 15900 then 16100 so put buystopmy buy is open from low, i move my SL to open price and will wait 5-7 day to minimum 16100 gap ok?
for now put buystop ( sl=15540 tp=16100 wait time=5 day ) on today high , if dax break today high and big trend line
90% will flyup to 16100 gap (put vey low size)
note= on above chart gaps comes from cash phisical dax trade in Germany,Frankfort
if you have sell , 100% put SL on today high or put hedge buystop size=2* total sell
if you have buy , be patient , move sl to 15500 and wait 5 day minimum to fibo 61%( dax low fibo 61%)
dax daily chart say= prnt.sc
if you are not dax trader and dont have minimum 5 year demo practice,dont pick this on real , dax is very special index (pick it in demo with very low size)
FDAX UpdateNo indication of gap direction for tomorrow. Total crapshoot.
Remember, gap direction depends on Europe, not EOD action. You guys should know that by now considering what happened last week.

While DAX Is Ending Consolidation, EURUSD Is Nearing SupportHello traders and investors!
Today we will talk about DAX and its positive correlation with EURUSD, as we see them approaching some interesting support levels.
Since March 2020, we can see DAX and EURUSD moving together most of the time, the only difference is that stocks are much stronger, however, as soon as we see stocks slowing down, even EURUSD comes lower.
What we currently see is that DAX is still in sideways consolidation and this is why EURUSD is coming down, but once DAX completes its corrective pattern within wave IV and starts rising into a wave V, then we can expect EURUSD to stabilize again, so be aware of limited downside for the EURUSD here around 1.11 - 1.10 area.
Trade well!
If you like what we do, then please like and share our idea.
Disclosure: Please be informed that information we provide is NOT a trading recommendation or investment advice. All of our work is for educational purposes only.

dont fear buy dax and hold until fibo 61% if you are dax trader pick this (if not pick it in demo account) trade dax and index need 5 year demo practice
let see cash xetra dax clear GAPS
alert= use very very low size ,per 1000$ equity max 0.01 lot (or 10$)
if you have old buys , you must put hedge sellstop in daily chart low near 14800( break it can crash dax to 14000
if you have open sell(not for hedged sell) move SL to open price , dont close your sell, pick buy above gap (if SL filled, sell cover loss)
strongly advice above 15000 dont pick new sell until fibo 61% near 15600
good luck ,keep monitor AC 30min and AC 4hour (if you are new ,only watch them near 1 year,dont trade with it , AC has many secrets)
personaly belive if price break low in 14800 , like 2008 financial criss , world wil inter new financial criss and dax can crash to near 10.000 so be careful, dont touch SL
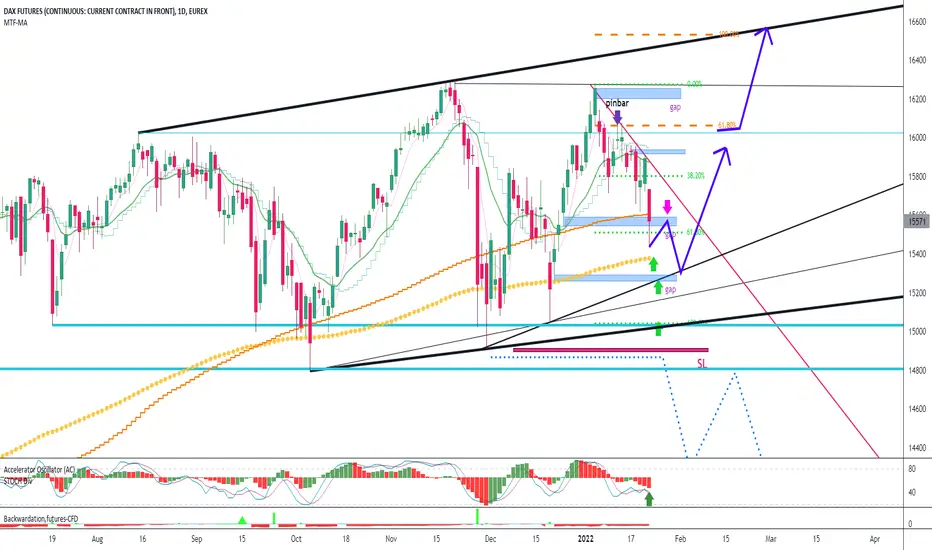
dax : on daily and 4 hour chart powerfull pinbar comes !!! yesterday i eat 2 SL on green arrow ,but 3th is open now , i want hold it 15-20 day until high
let see daily chart pinbar
prnt.sc
now = we have buy signal now but 100% put SL in pinbar low (5-6 point under low) ,try hold it 7-8 day to 16000 area
if you have old buys, put hedge sellstop in low , size=0.5* total buy , if low breaks ,dax can crash to 14000 or downer ,ok?
good luck ,keep monitor AC 30 and 240 min

Short 15230I was asked to give more meaningful descriptions. You know I am just an engineer and usually in my mailing lists I just write ‘long 100’ and at exit ‘flat 120’ without any explanation at all. Most signals are time critical so writing explanations would cost the costumers money. But I will try to give you a better understanding. My signals are generated by automated trading systems. So I often have to go into the source code to figure out what was the deciding factor for the signal. The systems generate about 10 to 20 signals a day so debugging can easily become a full time job. But in this case it was pretty simple to sort out what overruled the rivaling factors. It was a chart pattern that my colleagues and I named in german “hängender Schwanz”. I don’t know the exact translation but it means that the candlesticks show a period of preludium, followed by calmness with small candles in a clear trend, followed by a climax with high volume, a calm eye of the storm, followed by uncertainty, a reversion to a gradually falling slope and then an inversion into the opposite direction while repeating the whole move with reversed signs but some important differences. YM 35000+ was the eye of the storm. YM 34000 to 35000 was the uncertainty and now we flow into the inversion. FDAX is dominated by YM, so the same applies here adjusted by local factors like currency, time zone, monetary policy etc. The next few days into autumn will let us know if this is just a minor correction or a move over some month. Last two days we saw a small correction to the upside. New lows will follow.

dax daily: 3 place for next low we have other gap in 15250
EMA200 daily ( big orange line can be next low
if red trend line break, dax can fly up to new high around 16555
if 14800 low break(10% possible) = + trend switch to down trend
if you buy above 3 green arrow,dont close them soon , hold them to high (minimum 16000)
our SL and trailstop on dax is always 40 point
if you have big buy (dont put SL in low) you can hedge your buy near red arrow 15570(sell size=0.5*total buys)
dax have buy now, dont fear pick buy and hold 15 day dax fill gap now , pick low size buy above green arrow and dont close it soon ,dax target 1 is fibo 61% next target is (cash xetra dax) gap near 16200
if you have fear for buy,wait 1hour or 4hour or daily pinbar apear ,then pick buy and put sl under pinbar low
good luck

on dax buystop on today high possible above 3 green arrow is buylimit place with SL=40 trailstop=40
ADVICE= dont pick sell signals , 99% looking for buy in deep when dax is above EMA200 daily (big orange line) dax in way to 17200(weekly chart fibo 161%)
good luck

FDAX UpdateThe Euros tanked futures premarket, and they've already bounced, lol cheaters.
Bunch of unfilled gaps on the way down so expecting a bounce. Gonna wait until tomorrow though

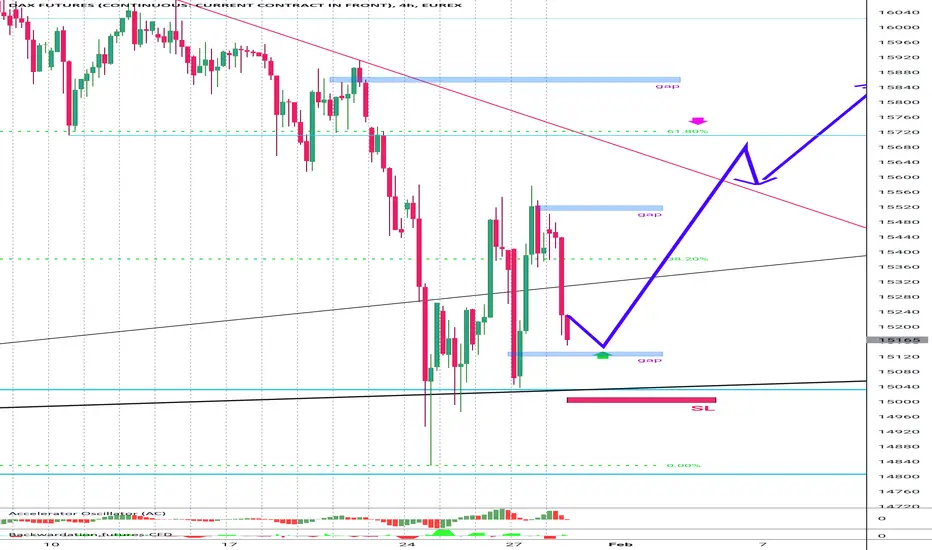
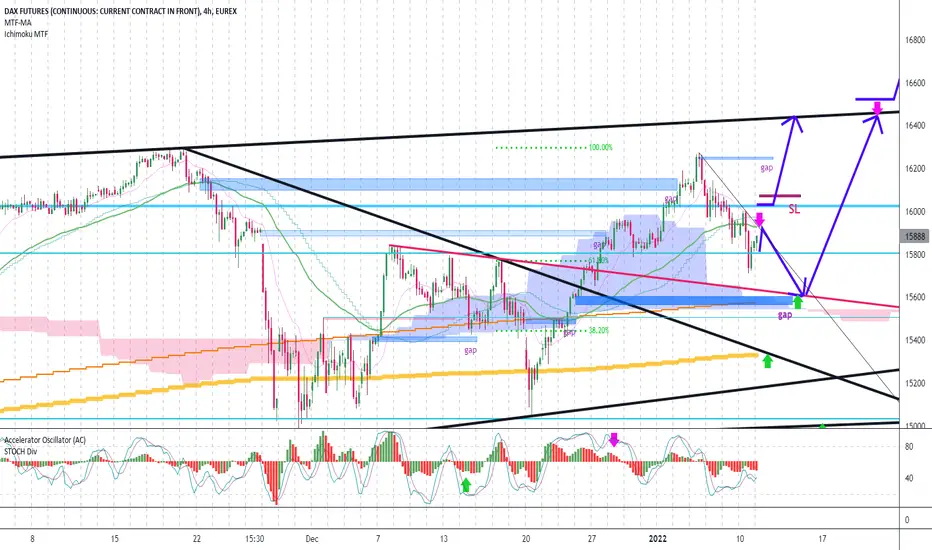
3 place we must put buy limit we are waiting for buy dax near 15620 ( gap + fibo 61%) winrate =90% sl=14940 wait time=min 10 day
SECRET=DAX love pullback ,touch fibo 61%
keep monitor AC accelator occilator on 4hour and 30min
if you have sell , 100% put hedge buystop in 16010(break trendline mean + trend will start
let see cash xetra dax chart, gap
witch gap will fill , 70% dax want fill 15600 old open gap
100% above green arrow put buylimit,after open hold it 14day (dont close soon) , we put buylimit on 15600 too
secret of dax= dax in way to 17200 (fibo 161% weekly chart show 17200) so above EMA200 daily 90% looking for buy
good luck

DAX 30 average stock drawdown ... DAX 30 average stock drawdown ... replaced indicator drawdowns of -30 % for -2 %

on dax we can sellimit under EMA200 1hour winrate =60% so sell low size ok? then buy above gap 15620(winrate=80%)
alert=dax can fly up to 17200(weekly chart fibo 161% show 17200 as dax target ,so never remove SL on sell sides )
in green arrow we can put buylimit with sl near 40 trailstop=40
wish you win

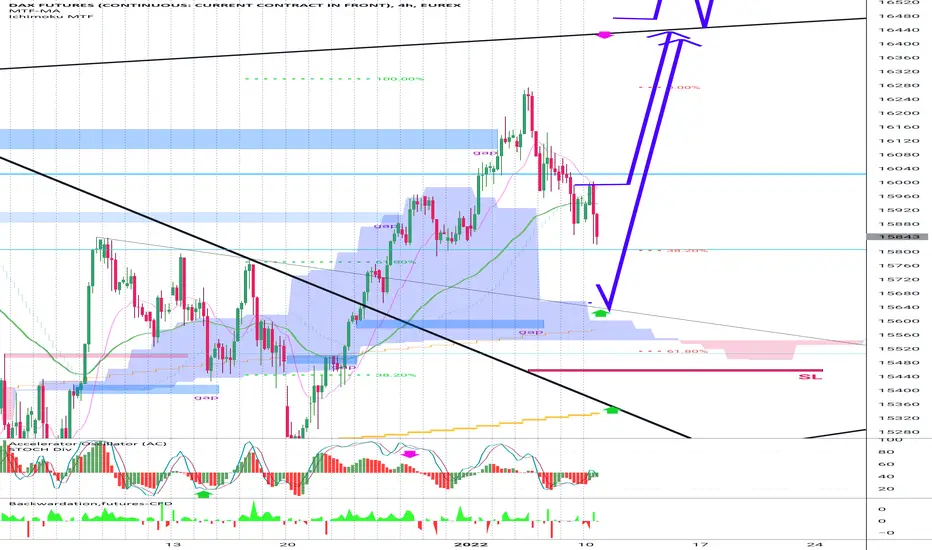
dax want fill gap on 16200let see cash xetra dax 1hour chart open gap
above green 2 green arrowput buylimit near 15620 is powerful order and dont close with little profit , hold it 10 day until upper red arrow (dax long term upper target is 17200)
if you have sell put tp near 15620
if you have buy , you can put hedge sellstop in today low
good luck and on dax keep monitor AC 30 and AC 240 min (work exclent on dax , but if you are new on AC you need min 8 month watching it reactions)
dax= buylimit above green arrow with sl=40 trailstop=80
despite dax little down move , it can fly up again , our old target is 17200 for dax
technicaly dax must fill big gap in 15600 (cash dax gap) but + trend pressure is very high , so reach 15600 need big bad news
if you have old sell , hedge it near EMA200 1 hour (green line)
if you have open buy , put SL on today low and wait 5-6 day to new high
if you have hedge buy,sell , never close buy frist ok? , in deep(low) move SL to your sell open price , then shot down your platform, go sleep 7 day , then in high near 16500 , close your buy
if you are in above -5000$ loss , please pm me

FDAX UpdateWent overbought on both RSI and MFI and reversed.
Bad news for the bulls because that more than likely means a gap down for the US market tomorrow morning
DAX: Further Rise ExpectedThe DAX is in high spirits. Having already risen into the white zone between 15966 and 16127 points, the index is likely to surpass it after a short corrective excursion into the orange area between 15625 and 15805 points. Once it has reached the support at 16295 points, the index might even jump into the second white zone between 16385 and 16545 points.
Alternatively, we have provided another scenario which is marked with a probability of 35% in our chart. The index might also fall below the resistance line at 14795 points and thus dive into the magenta colored area between 13805 and 14392 points. However, if it does so, it will soon jump out of the magenta pool, dry itself off and head north again.
Happy New Year!
