#202444 - priceactiontds - weekly update - daxGood Evening and I hope you are well.
tl;dr
dax xetra: Bearish. Bears finally got some follow through lower and got near 19000. Next they want to keep the pullback shallow and get a second leg down to weekly 20ema around 18800 which is also where the next bull trend line is on my chart. There we will see if it was low enough for bulls to buy or if we have to get even lower to 18000. Bulls need to get above 19400 and bears below 19000.
Quote from last week:
Market closed 200 points lower than last week but was mostly range bound. Bull trend line and the daily 20ema are still intact and we did not get the expected breakout. Market has absolutely no more room to inside the pattern. End of September market was at 19470 so we have a month of going nowhere behind us. Was it bulls scaling into longs for 20000 or bears scaling into shorts because the upside potential is probably very limited? Very likely both. Going into next week I can’t be anything but neutral until we see one side clearly giving up. The one thing that's clear on the weekly chart for the past 12 weeks is that bears only managed to print 1 bear in between bull bars. So 3 out of 13. That is really something and we should not expect it to end until it very clearly does. Don’t try to be the first.
comment: Big week for the bears since they broke the bull rally and most recent trend line, which turned the market neutral at previous support. Now comes the most important price action for the coming weeks. If bears get their strong second leg down, we will see 18200 in November, if we go sideways from here, odds drop for the bears and market is probably ranging more at the highs. It would also keep the possibility alive to print 20000 this year. The timing of the selling was in between very good earnings and mediocre outlooks. If we continue down, this would probably mean funds want to secure profits in this year and the selling could accelerate.
current market cycle: trading range
key levels: 18200 - 19700
bull case: Bulls did a decent job at keeping the market above 19000, which was important to disappoint eager bears from Thursday. If they now can trade above the daily 20ema and 19300, it would further weaken the bear case and we would likely continue inside the current trading range. 20000 is still the target for the bulls this year.
Invalidation is below 19000.
bear case: Bears showed some signs of life and we are now at the big decision spot 19000. Bears need to get better momentum going if they want to print below 18500. Above 19500 I can’t imagine many bears holding onto shorts because the risk of trading above 19700 are too great then. A measured move target down would lead to 18300 and that aligns with a 50% retracement and the September low. That is my preferred path forward over the next 1-2 weeks.
Invalidation is above 19400.
outlook last week:
short term: Neutral. Clear levels to break for both sides.
→ Last Sunday we traded 19463 and now we are at 19254. Ok’ish outlook.
short term: Bearish for a second leg down, as long as we stay below 19400.
medium-long term - Update from 2024-10-19: 20000 is the goal for 2024, if bulls do not get it until year end, it will probably not happen for the next 5-10 years. This market is beyond overvalued and will drop 30-50% in the next 5 years. I have no doubts about that. That fact should not be relevant to your trading at all.
current swing trade : None
chart update: Changed two legged correction into 3 legs down, target is the same for now.
DAX1! trade ideas

2024-10-30 - priceactiontds - daily update - daxGood Evening and I hope you are well.
tl;dr
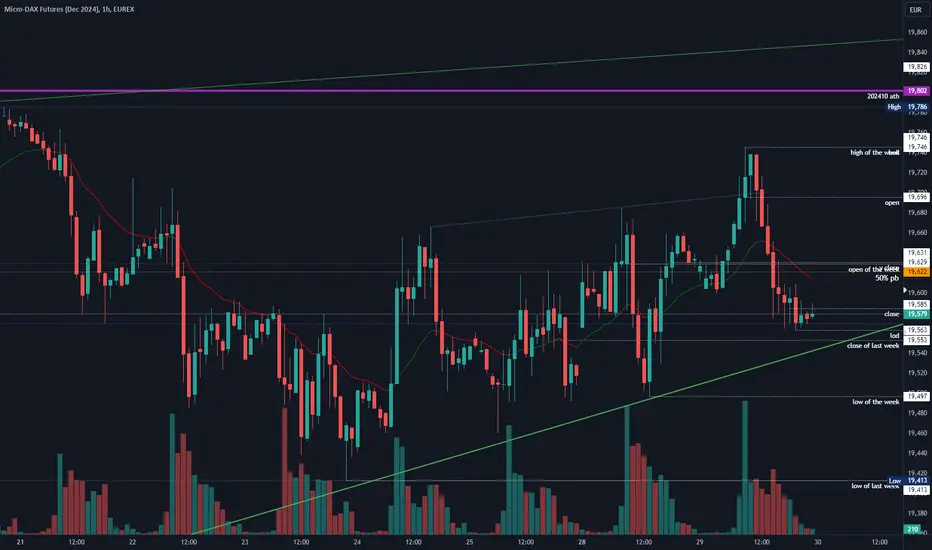
Indexes - Many bull trend lines are gone for good. Bears closed at the lows and they desperately need follow through tomorrow. If nq won’t keep the markets afloat tomorrow and drops below 20400, we will likely see a big sell off with 20200 or lower. Dax looks done, clear break of the trend line, swing shorts are juicy here.
dax futures
comment: Daily chart now looks really bad. Next support is around 19000-19100. If bears fail to generate follow through tomorrow, we could retest the bull trend line even up to 19600 again but as of now I heavily favor the bears to go deep red into the weekend.
current market cycle: trading range more likely than start of a bear trend but we only know once we reach 19000 and see if it’s support or not
key levels: 19000 - 19800
bull case: Bulls gave up today after the market failed to print a better close yesterday. Since they have been trying to go above 19800 for so long now, I do think many will wait for a deeper pull back to at least 19000 before buying again. They could try to retest the bull trend line up to 19600 but as of now, it’s a stretch. Got not much for the bulls here.
Invalidation is below 19000.
bear case: Bears now have the best setup in a long time. Clear trend line break and market has tested the highs more than enough. Bears next target is 19000 where we could expect bigger support. 19000 is the previous October low and an exact measured move from the current range down. I will watch futures open in an hour and will likely get on some swing shorts.
Invalidation is above 19620.
short term: Bearish for 19000 if we stay below 19620. My bullish targets are met with this lower high and trend line break. Expecting a deeper pull back before a year end rally.
medium-long term - Update from 2024-10-19: 20000 is the goal for 2024, if bulls do not get it until year end, it will probably not happen for the next 5-10 years. This market is beyond overvalued and will drop 30-50% in the next 5 years. I have no doubts about that. That fact should not be relevant to your trading at all. Right now there is no selling pressure. I am confident that we will hit 17000 in 2025 but timing is more important than price, so let’s not waste brain capital on being bearish for now.
current swing trade: None
trade of the day: Globex marked the high of the day and market just sold off. 19300 was expected to be bigger support and market showed a decent reaction where one should have covered shorts.

2024-10-29 - priceactiontds - daily update - daxGood Evening and I hope you are well.
tl;dr
Indexes - Mixed and still undecided. Not one broke out of their patterns today and I expected the breakout last Friday. Dax faked to the upside to sell off to the bull trend line again while nasdaq printed a strong bullish outside bar and is now near the top of the bull wedge. All patterns are still valid and the only constant is that bears are not able to generate follow through selling, so naturally market tries the opposite.
dax futures
comment : Daily chart says it all. Bulls not strong enough to close a day at the highs but bears even weaker and not able to print lower lows. 19600 is the middle of the range and mean reversion pays. I still lean more bullish than bearish for another run at the ath.
current market cycle: late bull trend
key levels: 19400 - 20000
bull case: Bulls broke above the minor bull channel but it was a trap and market sold off to near the bull trend line. As long as this line holds and market makes higher lows, I favor the bulls to retest the ath or go higher for 20000. The current trading range is fairly tight, so there is no deeper meaning to what the market is doing. No side has an advantage and we are waiting for the next impulse. Play the range until it clearly stops working.
Invalidation is below 19490.
bear case: Bears had a decent sell off today but market closed only 40 points lower. Bears need to start printing lower lows but most bears use the lows to cover and scalp out of positions.
Invalidation is above 19750.
short term: Bullish below 19600 for at least 19700. Stop is 19490
medium-long term - Update from 2024-10-19: 20000 is the goal for 2024, if bulls do not get it until year end, it will probably not happen for the next 5-10 years. This market is beyond overvalued and will drop 30-50% in the next 5 years. I have no doubts about that. That fact should not be relevant to your trading at all. Right now there is no selling pressure. I am confident that we will hit 17000 in 2025 but timing is more important than price, so let’s not waste brain capital on being bearish for now.
current swing trade: None
trade of the day: Buying before EU open was good if you were awake. The selling after the open surprised me big time and I absolutely did not expect bears to be able to get all the way down to below 19600. Good for you if you took it. Best trade was obviously selling 19700 and just holding. Was tough to take if you were long before, because the breakout look good enough.
#202443 - priceactiontds - weekly update - dax Good Evening and I hope you are well.
tl;dr
dax xetra : 4h chart shows a triangle if you adjust the bull trend line from August. It will break out on Monday and I clearly favor the bears to break below and go for 19000. Above 19650 I am wrong and we could see the leg up to 20000. Bear confirmation is only below 19300. Until the breakout, you can either wait or play the tight range.
Quote from last week:
comment: Bullish was good but the rally is losing steam. We are in the final leg before we probably transition into a trading range before we go down. 20000 is the target for bulls and I expect them to get it one way or the other. Preferred path is a spike followed by huge profit taking. Nothing about the chart is good for bears and I would not even think about shorts, before we see some decent selling again. You never want to be early in a trade as a retail trader.
comment: Market closed 200 points lower than last week but was mostly range bound. Bull trend line and the daily 20ema are still intact and we did not get the expected breakout. Market has absolutely no more room to inside the pattern. End of September market was at 19470 so we have a month of going nowhere behind us. Was it bulls scaling into longs for 20000 or bears scaling into shorts because the upside potential is probably very limited? Very likely both. Going into next week I can’t be anything but neutral until we see one side clearly giving up. The one thing that's clear on the weekly chart for the past 12 weeks is that bears only managed to print 1 bear in between bull bars. So 3 out of 13. That is really something and we should not expect it to end until it very clearly does. Don’t try to be the first.
current market cycle: Late bull trend. Has likely ended already and we are now in a trading range.
key levels: 19000 - 20000
bull case: We learned nothing last week, other that market is in balance at 19500. Bulls need to stay above 19320 to keep the trend alive and their target is 20000. How likely is follow through buying above 20000 and another bull break above for much higher prices? I can’t think of anything less likely tbh. That obviously does not mean it can not happen. I was wrong about the top a couple of times in the past 3 years.
Invalidation is below 19300.
bear case: If you look at this chart and go “I really want to short this right now”, dm me and let’s do a remote counselling session. You are so out of touch with the market, that there has to be deeper stuff going on inside you, causing that. Nothing about this is bearish and until we see actual selling pressure, we should not waste brain capacity on bearish thoughts. 19300 is the clear target for a daily close below. Once bears have that, we will likely test down to 19000 and there we have a big decision. Market can either find new buyers there in hopes of 20000 or most bulls are done for the year and let it go. Below 19000, nothing can save this until 18000. That is the lowest I can see this go this year and even that price is very unlikely.
Invalidation is above 19400.
outlook last week:
short term: Bullish for 20000. Can see a pullback first or not. We are in the middle of the channel, which is always a bad spot. Trade momentum or long a decent pullback.
→ Last Sunday we traded 19779 and now we are at 19463. Wrong outlook. Thesis still stands. If we keep above 19300, market wants 20000.
short term: Neutral. Clear levels to break for both sides.
medium-long term - Update from 2024-10-19: 20000 is the goal for 2024, if bulls do not get it until year end, it will probably not happen for the next 5-10 years. This market is beyond overvalued and will drop 30-50% in the next 5 years. I have no doubts about that. That fact should not be relevant to your trading at all. Right now there is no selling pressure. I am confident that we will hit 17000 in 2025 but timing is more important than price, so let’s not waste brain capital on being bearish for now.
current swing trade: None
chart update: Adjusted the potential two legged correction

2024-10-24 - priceactiontds - daily update - daxGood Evening and I hope you are well.
tl;dr
Indexes - Bulls bought the lows as was expected but they could not close the day with a strong bull bar. Instead we printed weak bull bars or inside bars. Are we any smarter today? Not much. Both sides are to weak to show a clear direction and so we mostly move sideways. Bears do not have any arguments after not getting any follow through. Bulls at least closed it above the daily 20ema, so we are still inside the bullish patterns and upwards is more likely than down.
dax futures
comment: We have formed nested triangles and I have no opinion on who might win the breakout. Today my bias was heavily bullish and that paid big time in the morning but then the weak bulls surprised me. I do expect the breakout to happen tomorrow.
current market cycle: late bull trend
key levels: 19400 - 20000
bull case: Bulls broke above yesterday’s trading range which was an obvious magnet but were not strong enough to get above Tuesday’s highs and closed the day slightly above the open price. The formed triangle will likely play out in tomorrow’s EU session and during the US session we should see a bigger breakout. Bulls still have the valid 20000 target.
Invalidation is below 19300.
bear case: Bears are showing signs of life and the pattern the market has printed over the past 2 months, shows us that we are late in this bull trend and the end is probably near. I have little doubt that if we get to 20000, the high should be around that price and if you can hold shorts for longer and scale in higher, it will be an amazing short opportunity. Until bears print a big bear bar below the bull trend line and daily 20ema, this market is still inside the bull trend.
Invalidation is above 19700.
short term: Neutral. 19413 should hold as the low and I slightly favor the bulls to break above the triangle but I will wait for strong confirmation or buy longs on decent pullbacks.
medium-long term - Update from 2024-10-19 : 20000 is the goal for 2024, if bulls do not get it until year end, it will probably not happen for the next 5-10 years. This market is beyond overvalued and will drop 30-50% in the next 5 years. I have no doubts about that. That fact should not be relevant to your trading at all. Right now there is no selling pressure. I am confident that we will hit 17000 in 2025 but timing is more important than price, so let’s not waste brain capital on being bearish for now.
current swing trade: None
trade of the day : Yesterday I wrote this is a strong buy and so it was. Buying the Globex low while bar 24 formed was an amazing trade.

2024-10-23 - priceactiontds - daily update - daxGood Evening and I hope you are well.
tl;dr
Indexes - Big bear day on most indexes but they did not accomplish enough to flip the markets to always-in-short. I do think the odds of a bullish reversal into the weekend are much greater than continued selling. Many markets are at perfect support and buying this is a no-brainer for many bulls. We still have bullish targets above us (e.g. sp500 → 6000 and dax to 20000).
dax futures
comment: Bulls have waited for this pullback a long time and I highly doubt they will let it go to waste. Very high chance of this being a bear trap and we melt from here. Wait for confirmation before you trade this. We are right at the daily 20ema and the big bull trend line from August. Buying with a stop 19416 is probably risky but could work. Waiting for bears to try 19400 again might be wiser but it depends on tomorrows price action. Last thing I want to do here is enter new shorts. As mentioned in my weekly update and over the last weeks, 20000 is the target and I doubt the market can move significantly lower without touching it. Buckel up for tomorrow and Friday, we will see some big moves.
current market cycle: bull trend
key levels: 19400 - 20000
bull case: Bulls got the textbook pullback to huge support and they want to go straight up to 20000 from here. There is nothing more fancy to say about this. Look at the chart and wait for bulls to come around tomorrow, use a decent stop and let your trade run when it happens. Where would most bulls give up? Tough. It’s probably not 19399. Many will scale in but I do think this should not go below 19300 or the bull case is likely over.
Invalidation is below 19300.
bear case: Bears had a strong day but did not close below the daily ema and the big bull trend line. Zero doubt that bears will give up quickly once bulls come around because they know it’s big support. They made some decent points the past 3 days and most won’t overstay their welcome. If they manage to get below 19300, they would flip the market to always in short and their next targets would be 19100. Very unlikely that will happen but it’s possible, so I think it’s useful to mention.
Invalidation is above 19480.
short term: If we stay above 19400, max bullish for 20000.
medium-long term - Update from 2024-10-19 : 20000 is the goal for 2024, if bulls do not get it until year end, it will probably not happen for the next 5-10 years. This market is beyond overvalued and will drop 30-50% in the next 5 years. I have no doubts about that. That fact should not be relevant to your trading at all. Right now there is no selling pressure. I am confident that we will hit 17000 in 2025 but timing is more important than price, so let’s not waste brain capital on being bearish for now.
current swing trade: None
trade of the day: Selling 19570 has worked on Tuesday and so today. Obvious resistance.

2024-10-21 - priceactiontds - daily update - daxGood Evening and I hope you are well.
tl;dr
Indexes - Sideways movement with some lower lows but closes were mostly weak. Neutral going into tomorrow, since both sides can get the breakout. Market is still controlled by bulls until we close below the daily 20ema and those are far away.
dax futures
comment: Look at the daily or 4h chart, cause the lower time frames are misleading. This is not as bearish as it looks on the 15m chart. It’s still just a minor pullback in this bull trend and we still have not touched the daily ema. The bull trend line and daily ema are coming closer and we will probably chop more until we hit them. Then we see where the market wants to go next. I still expect 20000 but not much more. I am neutral until I have seen 20k or daily close below 19300.
current market cycle: bull trend
key levels: 19500 - 20000
bull case: Bulls did not find enough buyers above 19780 but they bought 19600, which was expected and important. We did not learn much and nothing changed to what I wrote in my weekly outlook.
Invalidation is below 19500.
bear case : Bears had a minor pullback but stayed inside the trading range under the ath. Nothing to get excited about. Will they try to get follow through tomorrow and fight for this to hit 19500? Less likely than bulls buying the dip again.
Invalidation is above 19820.
short term: Neutral inside given range. Still favoring the bulls for 20k but we could hit 19400 first.
medium-long term - Update from 2024-10-19: 20000 is the goal for 2024, if bulls do not get it until year end, it will probably not happen for the next 5-10 years. This market is beyond overvalued and will drop 30-50% in the next 5 years. I have no doubts about that. That fact should not be relevant to your trading at all. Right now there is no selling pressure. I am confident that we will hit 17000 in 2025 but timing is more important than price, so let’s not waste brain capital on being bearish for now.
current swing trade: None
trade of the day: Selling 19770 since market found no buyers above that price and produced many tails. The EU open was just weakness and we did not stop until we hit 19600.

2024-10-17 - priceactiontds - daily update - daxGood Evening and I hope you are well.
tl;dr
Indexes - Bullish spikes on all of them but markets closed mixed. All closed with a big tail above and we are where we closed yesterday. Near but still above the daily 20ema, near bull trend lines but also with bulls not strong enough to get a big breakout above with follow through. Most of the current patterns are in their last stages and the breakout will happen over the next days. I am neutral for now and scalp in both directions.
dax futures
comment: Big spike to new ath but also big rejection. Market is contracting inside the clear bull wedge. I doubt we get the breakout tomorrow but it could happen but next week for sure. Where will this break out to? Right now I favor another leg down to 19500ish more than a breakout above. On the daily chart it’s bullish and nothing else. I still do have my 20000 target.
current market cycle: bull trend
key levels: 19500 - 20000
bull case: Bulls touched 19800 and got rejected, no surprise there. Only question is how fast do will they retest that price. It’s possible that we need to sell some more to find new buyers but I do think bulls have a better chance of the blow off top if they stay above 19600. Since we are oscillating around 19700, I can’t be anything but neutral for now.
Invalidation is below 19500.
bear case: Bears need a daily close below 19500 to break outside the bull wedge inside the bigger bull channel on the daily chart. Volume is increasing which is better for the bears than the bulls but they can’t print one decent daily bear bar and until that changes, you simply can not be a bear here.
Invalidation is above 19820.
short term: Neutral. Bullish above 19820 and bearish below 19500.
medium-long term - Update from 2024-10-06: 3 Months left in 2024 and I do think the market is in a trading range where the upper area is around 19500 and the lower area is probably 17000 or 16000 if something bigger comes up. Since we are at the very top, I expect the market to go some sideways before trying to go down again. Not so sure about 19491 being the high, since liquidity could see a bigger increase and upside could be higher. We will likely have another 10%+ correction this year and a possible year end rally.
Update 2024-10-13: Possibility of a blow-off top to 20000 is there. If we get there, it will be the short opportunity of the decade.
current swing trade: None
trade of the day: S elling 19800 or buying the opening breakout above 19640, which was good for 160 points.

2024-10-15 - priceactiontds - daily update - daxGood Evening and I hope you are well.
dax futures
comment: A daily bear bar closing on it’s low. What a time to be alive. Kinda in the middle of the channel now, which is a bad bad place to trade. Both sides have valid arguments. I would rather sit on hands and only scalp on momentum than initiate trades around 19600.
current market cycle: bull trend
key levels: 19500 - 20000
bull case: Bulls can be happy a decent dip came which they can now buy. Will they buy 19600 or will they wait? I am not sure but would you really want to buy 19600 now in hopes of a climactic continuation above 19800? Hard to make that a good trade. I do think the rally was fueled by momentum, that is gone now.
Invalidation is below 19500.
bear case: Bears finally got a decent day and they want/need follow through tomorrow. Obvious targets to hit next are 19350ish (breakout price) and the potentially much bigger support at the daily 20ema and the bull trend line around 19300-19350. If we get there, I highly doubt bears will push their luck and we see another strong move up. On the 1h tf, the first target for tomorrow is the open of the week 19536 and that is also where a smaller bull trend line is. Can be bigger support and bears could also give up there. Hard to make a bigger bear case for now but it’s worse for the bulls to blindly buy this just because we dipped some.
Invalidation is above 19800.
short term: Bullish but a bit more neutral right now, until we know where the next support is and bulls come around again
medium-long term - Update from 2024-10-06: 3 Months left in 2024 and I do think the market is in a trading range where the upper area is around 19500 and the lower area is probably 17000 or 16000 if something bigger comes up. Since we are at the very top, I expect the market to go some sideways before trying to go down again. Not so sure about 19491 being the high, since liquidity could see a bigger increase and upside could be higher. We will likely have another 10%+ correction this year and a possible year end rally.
Update 2024-10-13: Possibility of a blow-off top to 20000 is there. If we get there, it will be the short opportunity of the decade.
current swing trade: None
trade of the day: Shorting 19750 was not the hard part about the short trade but holding through bar 38 - 52 was. Had to get short bar 32 or latest 33. Can you hold afterwards? Tough. Open price was an obvious magnet when we hit 19650, so do you want to hold through a 60 point up move when you are short? I did not. Could have gone short below bar 57 but then you see the spike and hope for more and when you hold, market reverses bad again and you are underwater or break even at best. Then you do what? The 15m 20ema was decent to short then but all in all tough because market wanted lower but also produced many big tails below the bars that touched 19600.

2024-10-14 - priceactiontds - daily update - daxGood Evening and I hope you are well.
tl;dr
Indexes - In my weekly post yesterday I wrote “max bullish” a couple of times and I hope you did not short this today. Bulls are in absolute control and they have no reason to stop buying every small dip. You can not be a bear on the hope that this madness will stop eventually. It can go much further than you can imagine. Strong day, strong close, can only expect higher prices until bears print consecutive big bear bars on higher time frames. My best guess is still a blow-off top this week, which can mark the top before we see a bigger correction. Today felt like we are already in it.
dax futures
comment: Bulls got follow through and confirmed Friday’s bullishness. There is nothing bearish about this so don’t waste time looking for bear arguments. You never want to be the first in trading unless you are a big institution who needs to scale into positions because you literally move the market otherwise. 19700 is almost a given but buying high is not the way to go here. Wait for decent pullbacks. Today the 30m 20ema was perfect to buy on 3 occasions.
current market cycle: bull trend
key levels: 19500 - 20000
bull case: Bulls are close enough to 20000 and bears absent to enough to expect that we get there. We have formed a proper channel where the lower trend line is around 19600. If that holds, it’s max bullish again but we could also reach the bigger trend line around 19500 before going higher again. Since bulls literally bought every dip since Wednesday, expect for them to continue to do so.
Invalidation is below 18500.
bear case: Best they can hope for is sideways movement and maybe get down to the 1h 20ema. Anything below 19500 would surprise me. Their target is to test the 1h 20ema and the lower bull channel line around 19600ish. If they somehow break that, their next target would be the price area around 19550.
Invalidation is above 18720.
short term: Max bullish until bears come around. Look for longs.
medium-long term - Update from 2024-10-06: 3 Months left in 2024 and I do think the market is in a trading range where the upper area is around 19500 and the lower area is probably 17000 or 16000 if something bigger comes up. Since we are at the very top, I expect the market to go some sideways before trying to go down again. Not so sure about 19491 being the high, since liquidity could see a bigger increase and upside could be higher. We will likely have another 10%+ correction this year and a possible year end rally.
Update 2024-10-13: Possibility of a blow-off top to 20000 is there. If we get there, it will be the short opportunity of the decade.
current swing trade: None
trade of the day: Close of last week held during Globex, EU opened could not even get down there, that was the last big hint bulls mean business and you should get long. Only real tricky thing today was to either hold through bar 32 - 34 or get long again on bar 49 or 54.

2024-10-10 - priceactiontds - daily update - daxGood evening and I hope you are well.
tl;dr
dax - Perfect two legged (ABC) correction on the 1h tf and now bulls are free to continue the short squeeze. Buckle up. Bears are only allowed to speak below 19250. If bears manage that, next target would be 19100 and a continuation of the trading range since last Tuesday. My swing long is going.
comment : My line in the sand for the bulls was 19250 and the low was 19276. Bulls now want the third big leg up tomorrow and they have all the reason to assume it will happen. We have a perfect bull trend line, so watch what the market is doing around it and don’t short until it’s broken. I’m full bull here.
current market cycle: bull trend
key levels: 19000 - 20000
bull case: Bulls want the third leg to 19600+. That’s it. As long as the bull trend line holds, it’s bullish. You can either long now or wait on a breakout above 19450 with follow through. Either is fine. Stop is obvious (if not, ask me).
Invalidation is below 19276.
bear case: Bears fumbled it today. Selling was decent but they could not get below the breakout price 19270 and if bulls start the better buying tomorrow, I don’t think we will see much fighting. If bears somehow manage to print below 19250, consider me surprised and that I am wrong.
Invalidation is above 19450.
short term: Max bullish. Stop is still 19250.
medium-long term - Update from 2024-09-01 : 4 Months left in 2024 and I do think the market is in a trading range where the upper area is around 19000 and the lower area is probably 17000 or 16000 if something bigger comes up. Since we are at the very top, I expect the market to go some sideways before trying to go down again. Next 2000 Points will be made to the downside but it’s too early to short this.
current swing trade : Can do long now, 19358 or wait on breakout. Stop is the same.
trade of the day: Selling 19400 was decent I guess but on these days you find the middle of the range and scalp.

2024-10-08 - priceactiontds - daily update - daxGood evening and I hope you are well.
tl;dr
dax - Do or die for the bears at exactly at the bear trend line and last weeks close and also Monday’s pullback high around 19260. Above 19290, bulls are favored for a breakout and target 19330 or higher. If we turn here, I expect 19100 or lower.
dax futures
comment: Watch the 30m 20ema tomorrow and see if bulls can hold above it. The 19250-19280 area should be resistance and I favor the bears, once we drop below 19200 again. Bulls want the breakout above 19280 and then a strong move for a retest of 19491 ath. We are near are exactly at two very important trend lines. One is the big bull trend line from early August (please see my weekly post and chart) and the other is the bear trend line from the ath. I expect a huge day tomorrow, once we know who wins the battle. Right now I think odds are 50/50.
current market cycle: bull trend (big trend line is currently at 18950 on xetra) - close below 19000 ends that bull trend
key levels: 19000 - 20000
bull case: Bulls need to break above the bear trend line to stay above the bull trend line and daily 20ema. Market traded the 4th consecutive day around the daily ema and tomorrow we will likely have a huge breakout. If bulls win, we will probably retest the ath.
Invalidation is below 19000.
bear case : Bears are in do or die mode. Either reverse hard and stay below the bear trend line, or give up and see 19400+ again. Both sides showed strength this week and there is no clear direction for tomorrow. Bear case gets better once we trade below 19200 again.
Invalidation is above 19280.
short term: Neutral between 19200 - 19280. Bearish below, bullish above. Best to wait for the breakout tomorrow or Friday but I favor tomorrow.
medium-long term - Update from 2024-09-01: 4 Months left in 2024 and I do think the market is in a trading range where the upper area is around 19000 and the lower area is probably 17000 or 16000 if something bigger comes up. Since we are at the very top, I expect the market to go some sideways before trying to go down again. Next 2000 Points will be made to the downside but it’s too early to short this.
current swing trade: Will swing in the direction of tomorrows breakout
trade of the day: Strong selling through Globex but market made a tripple bottom near 19050 and whenever the market tries to do something 2-3 times and fails, it will likely try the opposite. Long above 19130 - bar 10 was a very good trade.

2024-10-02 - priceactiontds - daily update - daxGood Evening and I hope you are well.
tl;dr
dax - 3 clear legs down and today’s selling could not reach the lower bear trend line, which showed weakness by the bears. We are close enough to the daily 20ema to expect bulls scaling into longs and hoping for a retest of 19400/19500 or higher. 1h 20ema held today too but I expect it to be broken tomorrow. Below 19200, 19000 will come fast.
comment: Not happy with the currently drawn bear channel, since market has only 1 touch of the upper trend line. I expect sideways to up movement tomorrow until we touch it and there bears have to defend it for another try at 19200. I am neutral around 19300 and can’t see bears doing another strong leg down tomorrow.
current market cycle: bull trend (big trend line is currently at 19000, minor bull trend line got hit today)
key levels: 19000 - 20000
bull case: Bulls bought the minor bull trend line that started 2024-09-11 and probably also the daily 20ema which is only 200 points lower. It was also the August high 19217. Bulls want to make 19200 support that was previously resistance before market broke strongly above it for a new ath. Bulls know that this is the first pullback in an otherwise very strong bull trend and high 1 are almost never working strongly for bears. Bulls see this as a pullback and scaling into longs, that is why we have tails below the prior 2 daily bars. Next they want to break above the 1h 20ema and retest today’s high 19428 - above that price comes 19500 probably quick because I expect many bears to have their stops there.
Invalidation is below 19190.
bear case: Bears had 3 legs down and today’s leg was weaker than before. Not good for them. They need to defend the 1h ema or risk a test of 19428. They do not have many arguments besides trading below the 1h ema. We are still above the daily ema and both bull trend lines. Either bears show strength tomorrow or bulls will take control again. Don’t. Short. The. Hole.
Invalidation is above 19430.
short term: Neutral around 19300. Bullish above 19430 and bearish only below big bear bars below 19200.
medium-long term - Update from 2024-09-01: 4 Months left in 2024 and I do think the market is in a trading range where the upper area is around 19000 and the lower area is probably 17000 or 16000 if something bigger comes up. Since we are at the very top, I expect the market to go some sideways before trying to go down again. Next 2000 Points will be made to the downside but it’s too early to short this.
current swing trade: None.
trade of the day: Shorting 1h 20ema again. The selling down to 19200 was weirdly strong.

2024-09-25 - priceactiontds - daily update - daxGood Evening and I hope you are well.
tl;dr
Indexes - Yesterday I promised you the breakout on Thursday and boi did we get one today. Problem for the bulls is, that they could not trap bears and they also could not close at the highs. That means, that the directional probability up or down is once again 50/50 (neutral). Most bull channels and wedges are still valid but if bears would have given up, we would not have seen 50-75% retracements of the leg up. Still bullish until bears print lower lows.
dax futures
comment: Big breakout, no more guessing about the direction. Now it’s a matter of how high can it get? It’s obviously a short squeeze and a stupid rally based on nothing but bear pain. Does that help you trading? No. There are several measured move targets and the next best one I have is 19600. Does not mean we have to get there but it also does not mean we can not hit 20000. Yes. 20000. Why are you still doubting this madness?
current market cycle: broad bull channel
key levels: 19000 - 19600
bull case: Bulls did it again. Most of the move happened during Globex and probably left many traders out of the market and had them chasing a second leg all day, which they got. Bulls did 4 clear legs up and that should be enough for now. Bulls kept buying the 15m 20ema all day and they also closed the EU and US session at their respective highs. You have absolutely zero reason to assume the highs are in. Look for pullbacks to get long until bulls clearly have no interest in higher prices.
Invalidation is below 19250.
bear case: Bears are in a world of pain. Every macro schmackro indicator points to a German recession and the auto industry is giving out warnings on earnings. Nothing makes sense from a “logical” standpoint. Welcome to trading. The sooner you realize this is a giant casino, the quicker you learn to let go and don’t care about this stuff. You have to trade your strategy and manage risk. Bears have nothing going for them and would need to get below 19250 before they have any case. Can this be a giant bull trap and we reverse strongly over the next 1-5 days? Everything is possible. Can you short this? Only if you want your account to be blown.
Invalidation is above 19500.
short term: Max bullishness if we stay above 19250. 19600 is my next best target before we can talk about the most insane of all targets, 20000.
medium-long term: Can not hold any bearish outlook on this breakout. Need to see the next pullback to calculate new targets.
current swing trade: None
trade of the day: The buying during Globex did not stop and the 15m 20ema held all day. Not one pullback dropped below the previous one. Just a very strong bull trend day and you can buy anywhere and make money if you hold. Sounds easier than it is, I know.

2024-09-25 - priceactiontds - daily update - daxGood Evening and I hope you are well.
tl;dr
Indexes - Sideways. I won’t write much about this. Markets refuse to go lower but also not much higher. Best now is to wait for the clear breakout that will likely happen this week. I have zero bias to which direction it will go. I am not a fortune teller. Both sides have reasonable arguments, despite this being one of, if not the biggest asset bubble in history.
comment: Market continues to contract. Many lines on my chart but all of them are valid until broken. Will see a bigger breakout tomorrow and or Friday.
current market cycle: trading range
key levels: 19000 - 19200
bull case: Bulls are somewhat very slightly favored since we are making higher highs and higher lows but barely. Not much changed since last Thursday. We are near the ath and market refuses to go down. Structure on the daily chart has potential for a breakout above. Wait for it to happen or scalp small.
Invalidation is below 19000.
bear case: Bears try but once market begins to stall they are out. Their only objective is to keep the market below the ath or near it. Not much more to say until they print something below 19000 again. Everything below 18800 would be amazing for the bears and would probably end this bull move.
Invalidation is above 19250.
short term: Neutral and waiting for the breakout. Bulls want above 19250 (roughly 19100 on xetra) and bears below 18800. Everything in between is a dead zone where market is in balance.
medium-long term - Update from 2024-09-01: 4 Months left in 2024 and I do think the market is in a trading range where the upper area is around 19000 and the lower area is probably 17000 or 16000 if something bigger comes up. Since we are at the very top, I expect the market to go some sideways before trying to go down again. Next 2000 Points will be made to the downside but it’s too early to short this.
current swing trade: None.
trade of the day: Buying 19000 or shorting near 19100. Bear trend line from 19195 was decent to short.

2024-09-23 - priceactiontds - daily update - daxGood Evening and I hope you are well.
tl;dr
Indexes - Talk about pinning at a specific price. Most markets moved inside tight trading ranges between last week’s close and today’s open price. Was it bulls scaling into longs because we will rip higher (accumulation) or bears selling the highs because we crater soon (distribution)? Yes.
We have learned nothing today and you can move on now.
dax futures
comment: Dax was the anomaly today and surprised me with the strong close. Market refused to go down while most others chopped in tight ranges. The 50% pb from Friday’s selling is 19030 and we closed at 19000. Anything above 19100 would be very bullish but I favor the bears to retest at least 18900 tomorrow. That outlook is somewhat low probability until bears can break outside of the current bull channel on the 15m tf.
current market cycle: trading range
key levels: 18800 - 19200
bull case: Market refused to go down after the EU open reversal and we had a spike and channel bull trend day. As long as the bull channel is alive, bulls are fine. Their targets above are 19100 and then 19200 obviously. Given the atrocious pmi data earlier today, this rally feels off and is likely a squeeze. Does that help with trading? No. Can go much higher than anyone expects but right now anything above 19100 would surprise me, again.
Invalidation is below 18970.
bear case: Bears tried a couple of times today but were not strong enough to even retest the open price after we went above 18980 during the EU session. We are near the 50% pb and it’s possible that they come around tomorrow and try to get down to 18800 but as of now they don’t have good arguments. Their first target is to make the market go sideways and break out of the bull channel. Then they need a strong close below 19000. On the daily chart nothing changed after today.
Invalidation is above 19100.
short term: Neutral and bearish once the bull channel is broken for at least a retest of 18900. Bullish above 19100 for 19200 or higher.
medium-long term - Update from 2024-09-01: 4 Months left in 2024 and I do think the market is in a trading range where the upper area is around 19000 and the lower area is probably 17000 or 16000 if something bigger comes up. Since we are at the very top, I expect the market to go some sideways before trying to go down again. Next 2000 Points will be made to the downside but it’s too early to short this.
current swing trade: None.
trade of the day: Buying 18850 was profitable on Friday and so today. Bar 29 was a perfect signal bar and 30 the entry bar. Stop 1 tick below the signal bar and that was good for 200+ points. I was too busy looking for shorts that I did not take many good long setups. Bad trading on my part.

2024-09-17 - priceactiontds - daily update - daxGood Evening and I hope you are well.
tl;dr
Indexes - Many new highs but also a deep pullback and we closed around the middle of the daily range. Are we smarter than yesterday? We know that bulls remain in control since we are trading above most higher tf ema but bears also sold off for 1% today on the sp500. I keep my neutral stance and wait for the FOMC debacle to be over with. No one knows where markets will go on either 25 or 50bps. Be more like Elsa, let it go. You don’t have to gamble away hard earned profits on max confused and undecided markets.
dax futures
comment: Bulls got above my given target 18750 in my weekly update but got rejected for almost 200 points. Market is still neutral imo and I don’t expect this to change until some hours after FOMC. Since the market is so confusing and no one knows where rates might go, we can expect traps before and after FOMC. I refuse to trade much tomorrow.
current market cycle: big bull wedge on the daily tf and bull channel on the 1h tf
key levels: 18600 - 18900
bull case: Bulls printed 18800 and this could have been it before FOMC. We are 270 points below the ath (xetra) and we could easily get there. That’s also the only target left for the bulls. As long as the bull channel holds, they are in control and favored for higher prices.
Invalidation is below 18600.
bear case: Bears reversed much of today’s gains and did so in a fast manner. Bulls still bought it again, like the previous week. Bears need to start making lower lows again or bulls continue to btfd. Bears first target is to get below 18600 which would also break the bull channel. If you look at the daily chart we have many tails above and below bars. Bulls are grinding higher but it can reverse quickly imo. 1h ema is pretty flat, so don’t get trapped selling low or buying high.
Invalidation is above 18820.
short term: Neutral. Only scalping small positions until we know how market thinks FOMC is to be interpreted.
medium-long term - Update from 2024-09-01 : 4 Months left in 2024 and I do think the market is in a trading range where the upper area is around 19000 and the lower area is probably 17000 or 16000 if something bigger comes up. Since we are at the very top, I expect the market to go some sideways before trying to go down again. Next 2000 Points will be made to the downside but it’s too early to short this.
current swing trade: None
trade of the day: Globex lows held and the long after the double bottom around 18680 was good. Also selling the second try by the bears when bulls failed at 18800 (double top) but it’s hard to be this flexible on bigger swings. If you took one of those, you probably had an amazing day.

2024-09-11 - priceactiontds - daily update - daxGood Evening and I hope you are well.
tl;dr
Indexes - What a bear trap that was. Many decent double bottoms and then straight up melting. Many markets did not even touch the 3m 20ema on the move up. Bulls took full control again imo and I expect the highs to be retested, if not broken. SP500 the strongest of the ones I trade. Very very low chance of this being a bull trap after a bear trap and we reverse hard tomorrow but at this point of the chop, I won’t rule anything out.
dax futures
comment: Dax is not looking that strong like the sp500 does. Technically it’s currently just a two legged pullback to the daily ema and odds still favor the bears for another leg down. If the bulls break above 18550, that changes and bulls are favored to trade back to 18800 and above. Very important day tomorrow.
current market cycle: trading range until either 18550 or 18200 broken
key levels: 18200 - 18550
bull case: Strong reversal after the double bottom around 18220 today. If bulls generate follow through above 18550 tomorrow, many bears could give up and we see an acceleration upwards.
Invalidation is below 18400 (not sure about the invalidation level as of now).
bear case: Bears need a bit of a miracle tomorrow to prevent the bulls from breaking above 18550. The bear channel is gone and the 4h ema too. What arguments do bears have? Well, the current price action is wild in both directions. Since Friday we are in a 400ish point trading range. Technically, on the daily chart, it’s still just a two legged pullback to the daily ema and bears could try to get another leg down, I just highly doubt those arguments are better than the bullish ones.
Invalidation is above 18550.
short term : I wait for the breakout above given price. Bears would need to trade below 18400 before I think about shorts again. 18500 is a bad spot to enter new positions.
medium-long term - Update from 2024-09-01: 4 Months left in 2024 and I do think the market is in a trading range where the upper area is around 19000 and the lower area is probably 17000 or 16000 if something bigger comes up. Since we are at the very top, I expect the market to go some sideways before trying to go down again. Next 2000 Points will be made to the downside but it’s too early to short this.
current swing trade: None.
trade of the day : Short near the 4h ema was once again a very good trade. Buying the double bottom bar 4 Tuesday and bar 4 today.

2024-09-10 - priceactiontds - daily update - daxGood Evening and I hope you are well.
tl;dr
Indexes - Dax puked hard but bulls are also making money there. Rest of my followed indexes were mixed. Bears still expect a bigger second leg down when you look at the daily charts. Add the bull trend lines to the current bear flags and wait for a break below. If we get it, I do think most bulls will cover. I am not too fond of buying currently.
dax futures
comment: 4h ema is your guide. Saw multiple rejections there again and sold off hard. Market is going straight up and down, bears are in control but both sides make money. We have a decent bear channel but bears were not strong enough to touch the lower trend line again, before bulls bought it aggressively. I think they can get it above 18420 or higher. If not, the bear trend could accelerate downwards but I doubt that. Overall markets are too two sided currently.
current market cycle : bear trend
key levels : 18200 - 18550
bull case: No close above the 4h ema, no breakout above previous highs but market is two sided enough for bulls to make money. No better arguments for them until they make higher highs and higher lows again. I think 18000 is probably the next bigger support where it could happen but bears already had 3 pushes down and pullbacks. Chances for a 4th or 5th leg down are very small so bulls could try to keep it above 18210.
Invalidation is below 18440.
bear case: Lower highs, lower lows. Bears are in control. No more magic to it. We have the 4h ema as a good sport to short and the upper bear channel line. Market did bounce 10 points above my calculated 50% pullback for the bull trend and tomorrow will be interesting if bears can do a lower high again and break below 18200. Much easier to trade this currently, if you look more at higher than lower time frames, which leads me to the argument for the bulls about the 3 pushes down. On the daily chart bears see one giant leg down and want another one. We are currently in a bear flag and if bulls fail to trade above 18700, odds favor the bears for a giant second leg down.
Invalidation is above 18523.
short term : Bullish for 18440+ but problem is the stop. If you would short 18303, where would you put it? Only good one is 18209 but that could easily get tested again. Best to not trade in the middle of the channel or only on very strong momentum. Above 18440 I favor shorts again, if we stay below 18523.
medium-long term - Update from 2024-09-01: 4 Months left in 2024 and I do think the market is in a trading range where the upper area is around 19000 and the lower area is probably 17000 or 16000 if something bigger comes up. Since we are at the very top, I expect the market to go some sideways before trying to go down again. Next 2000 Points will be made to the downside but it’s too early to short this.
current swing trade: Closed the shorts too early. Bad trading on my part. Read was good though. Also expected the bounce but got stopped out badly because I entered too early and market dropped way deeper than expected.
trade of the day: Short near the 4h ema.

2024-09-09 - priceactiontds - daily update - daxGood Evening and I hope you are well.
tl;dr
Indexes - Green across the board. On the daily charts it’s mostly a small to normal bullish inside bar, so nothing to get excited about yet for the bulls. Tomorrow will be very important for the bears. If they fail to test the lows again or stop the pullback, many bears could give up and let the bulls test the highs again. In my weekly outlook I wrote that the 4h ema is currently the most important one and almost all markets respected it and closed below. Will look for early weakness and want to short for retest of the Friday lows.
dax futures
comment: Market closed below the 4h ema so bears remain in control. I think the odds favor the bears for a retest of the lows and some more sideways movement before we get another impulse. On the 15m chart there is a clear bull channel which is good to trade for now. Will probably see a contraction in Globex and early EU session before a breakout above or below.
current market cycle: trading range - below 18260 we know we are in a bear trend inside the bigger trading range.
key levels: 18260 - 18600
bull case : Bulls need a 1h close above the 4h ema and the next target above is 18638 which is Friday’s high. If they get above it, most bears will give up on the bear trend pattern and we likely see acceleration upwards. Bulls need to defend the current bull channel where the lower trend line is currently around 18440.
Invalidation is below 18440.
bear case : Bears currently have 2 decent bear gaps on the daily chart. If they can keep the market below the 4h ema, that would help their case big time. Bear targets are 18400 and then 18300.
Invalidation is above 18550 (daily 20ema).
short term: Bears are still in control and the odds favor a second leg down. The pullback need to stay below 18550ish, give or take.
medium-long term - Update from 2024-09-01: 4 Months left in 2024 and I do think the market is in a trading range where the upper area is around 19000 and the lower area is probably 17000 or 16000 if something bigger comes up. Since we are at the very top, I expect the market to go some sideways before trying to go down again. Next 2000 Points will be made to the downside but it’s too early to short this.
current swing trade: Swing short since 18454 with SL 18600/18650. Will add higher if necessary.
trade of the day: Buying 18400 was decent today. Bulls defended that price and market was two sided enough for a couple of scalps.

2024-09-05 - priceactiontds - daily update - daxGood Evening and I hope you are well.
tl;dr
Indexes - Bears are selling the rips but most markets are contracting. Will most likely see a big move tomorrow but I don’t have a strong opinion on the direction. Very slightly favoring the bears for a bigger second leg down.
dax futures
comment: Y close was 18625 and today’s close was 18624. We oscillate around this price. Every time market does this, you are in a trading range and should not over analyze it. Look at the daily chart and get a sense of what the market is trying to do. Right now bears are in control but with every day of sideways movement, their control vanes and market becomes more neutral and I do think that if bears do not get their big second leg down started tomorrow, the chances of a break above or below are equal.
current market cycle: trading range - wait for a clear breakout above or below given key levels
key levels: 18500 - 18700
bull case: Bulls are making higher highs and higher lows but it’s still a tight bear flag on the daily chart. The bear gap to 18800 is still open and as long as that’s the case, bears are in control. Best bulls can do is make the market go sideways more until both sides are unsure about the next impulse, which means market is in balance. I think below 18500 most bulls will give up.
Invalidation is below 18500.
bear case: Bears are selling the rips but are not fighting for new lows right now. Market had is probably waiting for tomorrow’s US data to find more liquidity. No opinion on that data or the direction we will break out, other than I think bears are still favored for a second leg down. Should you be short right now in hopes of that? Clear no from me. Always better to get confirmation before entering the trade, unless you are good at scaling in and already rich af.
Invalidation is above 18750.
short term: Bears are in control and the odds favor a second leg down. Above 18700 I get more neutral and below 18570 I expect 18500 to follow soon and if bears break that, we will likely get the big second leg. Nothing changed in my short term outlook.
medium-long term - Update from 2024-09-01: 4 Months left in 2024 and I do think the market is in a trading range where the upper area is around 19000 and the lower area is probably 17000 or 16000 if something bigger comes up. Since we are at the very top, I expect the market to go some sideways before trying to go down again. Next 2000 Points will be made to the downside but it’s too early to short this.
current swing trade: None. Maybe tomorrow but only interested in shorts.
trade of the day: Buying the open was by far the best one. Again. Don’t get bearish at the lows or bullish at the highs in trading ranges. Betting on breakouts is a losing strategy when market is this undecided.

2024-09-04 - priceactiontds - short daily update - daxGood Evening and I hope you are well.
tl;dr
Indexes - Bearish bias confirmed. Bulls getting nervous by now. More bad data releases and markets are leaving bear gaps unclosed. Today we also made lower lows and the pullbacks were shallow. All good for the bears and the odds of another strong leg down and a measured move got higher today.
dax futures
comment: Bears kept the 140 point gap to Tuesday’s close open and that shows strength. Bulls could not get a bar above the 1h ema today and I’d be surprised if it stays that way. Bears are in control and they want a second leg down. A measured move would bring us to almost exactly 18000. Absolutely favoring the bears to do that instead of bulls getting above 18800 again.
current market cycle: huge trading range (below 18500 the minor bear trend inside the range is confirmed)
key levels: 17000 - 19000
bull case : Bulls can be happy if they can keep the market going sideways. Today’s open price was not tested and we closed above the daily ema, which shows some strength by the bulls. For higher prices bulls need a strong 1h close above the ema and that’s all I can come up with for the bulls right now.
Invalidation is below 18500.
bear case: Bears have the big round number 18500 to break for lower prices. They are clearly in control again and they want to stay below the 1h ema for a measured move down to 18000. Below 18570 I expect many bull stops to be hit and we will test 18500 and there I expect bulls to come around more strongly again and trying to hold it. We already have a decent looking bear channel or wedge on the 1h tf. I want to see what the Globex session brings and then I will decide tomorrow morning if I do a swing short for 18000 with a stop 18800/18850.
Invalidation is above 18750.
short term: Bears are in control and the odds favor a second leg down. Above 18700 I get more neutral and below 18570 I expect 18500 to follow soon and if bears break that, we will likely get the big second leg.
medium-long term - Update from 2024-09-01: 4 Months left in 2024 and I do think the market is in a trading range where the upper area is around 19000 and the lower area is probably 17000 or 16000 if something bigger comes up. Since we are at the very top, I expect the market to go some sideways before trying to go down again. Next 2000 Points will be made to the downside but it’s too early to short this.
current swing trade: Will decide Thursday morning if I do a swing short. 18000 would be my first tp and stop at least 18820.
trade of the day: Buying the open was by far the best one. Otherwise shorting 18670 the next best thing.

2024-08-29 - priceactiontds - daily update - daxGood Evening and I hope you are well.
tl;dr
Indexes - Bulls bought the big after hour dip yesterday and had a big rally but damn that was some big and fast selling in the last 2 hours of the US session. What did we learn today? Shift into Dax and DJI, since they just melted again and new ATH on both (dax xetra, not futures though) and rest of the markets made lower highs and lower lows. Still absolutely neutral imo but if bears get follow through tomorrow, the highs are probably in for this bull leg.
dax futures
comment: 3 clearn pushes up to a new xetra ath and volume is picking up again. Time for a reversal. Can you short this yet? I think so but stop has to be 19050ish and we are still above many bull trend lines. If you want higher probability, wait for bears to make lower lows again. Absolute ripper of a bull leg since early August and given the atrocious volume, had to be a short squeeze. I expect the next 2000 points will be made to the downside over the next 10 weeks.
current market cycle: huge trading range
key levels : 17000 - 19000
bull case: Bulls were relentlessly buying this but now with a new ath and all the remaining bear stops hit, market is free to do whatever. Bulls could do a blow-off top 19100/19200 before strongly reversing but i favor a retest of 19000 tomorrow before sideways to down movement. Bulls want to stay above 18800 as long as possible.
Invalidation is below 18800.
bear case: Bears want to trap as many late bulls as possible but before more bears come around and more bulls begin to take profits, we would need to start breaking bull trend lines and producing consecutive bear bars on higher time frames. The daily chart tells you everything you need to know as a bear right now. Below 18800 bears start to have some arguments but as of now, expect BTFD to continue until it has clearly stopped.
Invalidation is above 18800.
short term: If you get bullish at a new ath, no one can help you. Trend is your friend and all that but betting on another leg up is gambling at best. Scalp long if the momentum is there but get out early. This can and probably will turn soon. Absolutely neutral as of now and only touching it if one side is clearly in control. Caught a 60 point drop today, very happy with that.
medium-long term: 17000/17100 was my target for at least 3 months now and bears got it. We are in a correction since we dropped more than 10% from the ath. Many long term trader buy a 5%, 10%, … dip and a bounce here was expected. I do think we are in a bear trend which will most likely lead down to 15600 or 15000 over the next months but we can only be more certain, once this pullback is done and we make new lows below 17000 and have a channel from which we can calculate new targets. I called the highs in early July and there is a decent chance we will not see them for a long time. —unchanged since early July
current swing trade: Nope but long term shorts are looking juicy.
trade of the day: Buying the open was again very profitable. Long above bar 29 was very reasonable. Shorting below bar 72 was also a good trade, one which I took.
