It’s a Buy. DISNEYWeekly entry, strike ATH Great place to take a risk. Weekly hold above 50 and 200 MA
Key facts today
24,166.67
0.00 BRL
25.71 B BRL
469.97 B BRL
About Walt Disney Company (The)
Sector
Industry
CEO
Robert A. Iger
Website
Headquarters
Burbank
Founded
1923
ISIN
BRDISBBDR006
FIGI
BBG0025NPP60
The Walt Disney Co. engages in the business of international family entertainment and media enterprise. It owns and operates television and radio production, distribution and broadcasting stations, direct-to-consumer services, amusement parks, and hotels. It operates through the following business segments: Disney Entertainment, ESPN, and Disney Parks, Experiences, and Products. The company was founded by Walter Elias Disney on October 16, 1923 and is headquartered in Burbank, CA.

DIS Weekly Options Outlook (Week of 2025-06-09)📈 DIS Weekly Options Outlook (Week of 2025-06-09)
🧠 Multi-Model AI Consensus | NYSE:DIS
This week, multiple AI models show short-term bullish momentum for Disney ( NYSE:DIS ), but technical overbought signals and options market dynamics point to potential pullback risks near $113 into Friday’s e

The Walt Disney Stock Future Goes 'Shining Bright as Never'The Walt Disney Company’s stock (DIS) has demonstrated robust performance following its Q2 2025 earnings release a week ago, with both fundamental and technical indicators reflecting positive momentum.
Here’s a detailed analysis:
Fundamental Perspective
Disney’s Q2 2025 results exceeded expecta
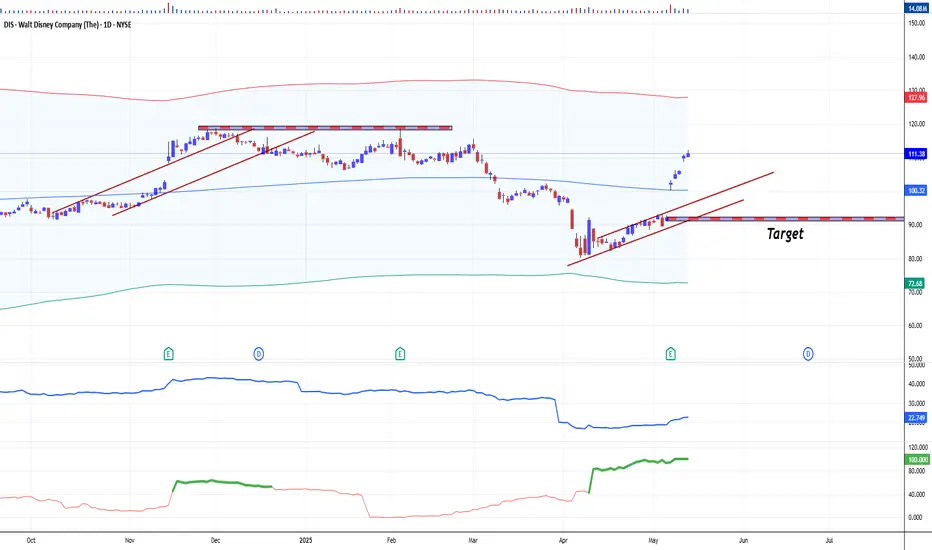
Disney Wave Analysis – 15 May 2025
- Disney rising inside impulse wave (1)
- Likely to reach resistance level 119,00
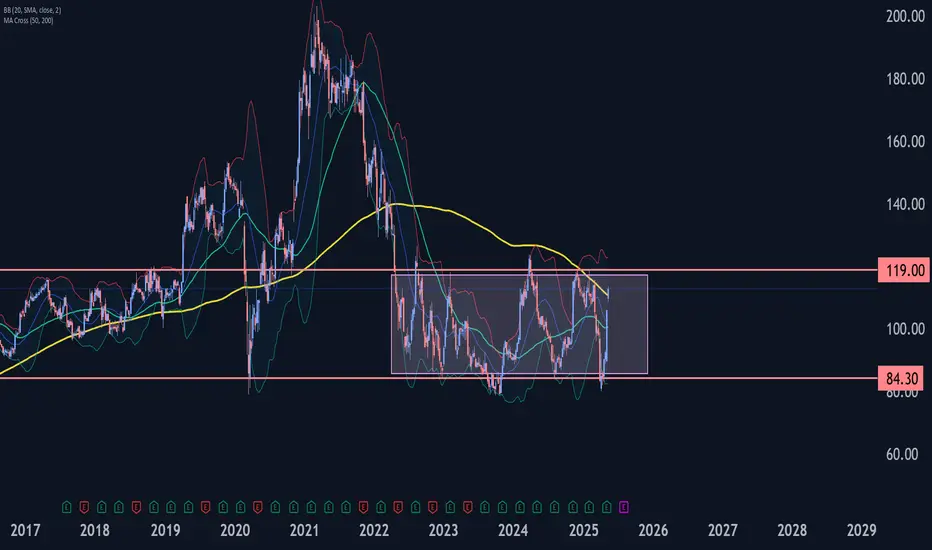
Disney continues to rise inside the sharp weekly upward impulse wave (1), which started earlier from the long-term support level 84.30 (which has been reversing the price from the end of 2022).
The support level 84.

DIS is already at $96.… Don’t miss the train!🚨 🎢✨Disney (DIS) is pushing up and showing strength — are you watching this move? 👀 We’ve been eyeing entry levels between $91 and $81, but with the price at $96.30, this setup is heating up faster than expected! 🔥
Sometimes the perfect dip doesn’t come — and waiting too long can mean watching the

Walt Disney Co | DISThe Walt Disney Company is reportedly exploring options to sell or find a joint venture partner for its India digital and TV business, reflecting the company's ongoing strategic evaluation of its operations in the region. The talks are still in the early stages, with no specific buyer or partner ide

DIS watch $84.19-84.56: Key support might say "Bottom Is In"DIS struggling to maintain any altitude at all.
Lost all of the tariff relief bump, looking weak.
See if bulls hold key support zone $84.19-84.56

Disney Stock Pops on Strong Earnings Data. Turnaround Working?The Magic Kingdom just pulled a rabbit out of its hat — and Wall Street’s loving it.
Disney stock NYSE:DIS surged 11% on Wednesday, not just for its best day in a year, but for the kind of earnings beat that makes analysts reconsider their entire valuation model while retail traders tweet “ NYSE:

Is Disney’s Chart Forming a Bullish Pattern Ahead of Earnings? Walt Disney Co. NYSE:DIS is set to report fiscal Q2 results next Wednesday (May 7) at a time when the entertainment giant’s shares have shed more than 20% since February and some 55% from their 2021 peak. What does the company’s technical and fundamental analysis tell us?
Let’s see:
Disney’s Fu

See all ideas
Summarizing what the indicators are suggesting.
Oscillators
Neutral
SellBuy
Strong sellStrong buy
Strong sellSellNeutralBuyStrong buy
Oscillators
Neutral
SellBuy
Strong sellStrong buy
Strong sellSellNeutralBuyStrong buy
Summary
Neutral
SellBuy
Strong sellStrong buy
Strong sellSellNeutralBuyStrong buy
Summary
Neutral
SellBuy
Strong sellStrong buy
Strong sellSellNeutralBuyStrong buy
Summary
Neutral
SellBuy
Strong sellStrong buy
Strong sellSellNeutralBuyStrong buy
Moving Averages
Neutral
SellBuy
Strong sellStrong buy
Strong sellSellNeutralBuyStrong buy
Moving Averages
Neutral
SellBuy
Strong sellStrong buy
Strong sellSellNeutralBuyStrong buy
Displays a symbol's price movements over previous years to identify recurring trends.
Curated watchlists where DISB34 is featured.


