Breakout on DIS after 120 days inside a Flag PatternToday we will speak about DIS; what are we observing right now?
a) The price has been on a Flag Patter for almost 120 days. Yesterday we observed a major breakout of it, and now we have defined confirmation levels for the bullish movement
b) Let's speak about the context first:
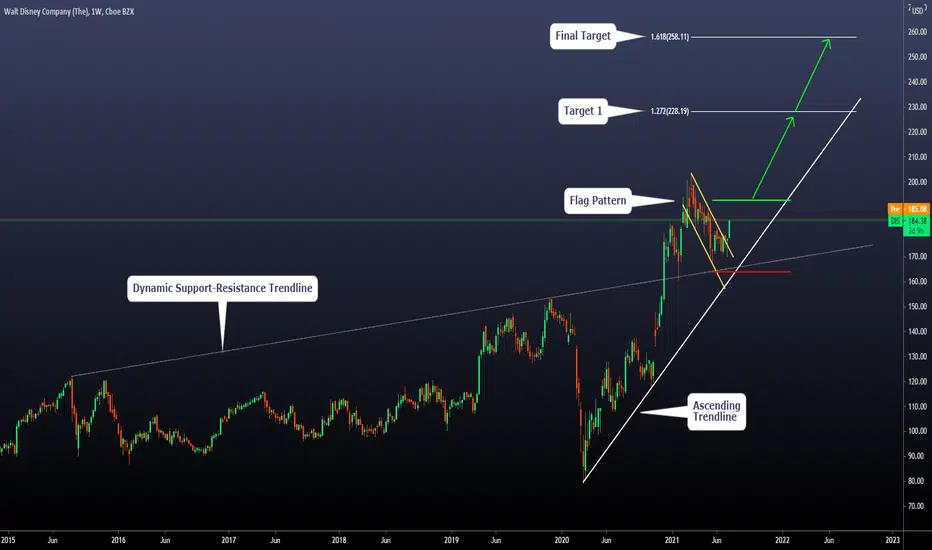
-The price is above a dynamic support resistance zone (positive for the bullish move)
-The Price is above the current ascending trendline (positive for the bullish move)
-We have observed a clear Weekly flag pattern above all the two areas, and now we have the breakout of it
c) Relevant levels: If the price reaches the Green horizontal line, we will consider that as a confirmation for our bullish view. If not, we will not execute the setup. Our stop level and also invalidation level (in case the price never executes our setup) is the red horizontal line (below the flag pattern)
d) We have defined two targets using fibo extensions. The first one can be used as a protective area where we move our stop loss to the entry-level or also as a preliminary take-profit zone. However, our final target is the 2nd fibo extension, where we will close all the setup if the expected movement happens.
e) How long can the setup take?: If the movement is successful, we think the resolution can be between 150 and 250 days.
f) How much would you risk on a setup like this?: ALWAYS 1% to 2% of our capital, Never more than that.
Thanks for reading!
DISB34 trade ideas

$DIS $200 Bound?Great Day trading DIS, hot on my watchlist tomorrow! Leave a like and follow if you dig this content!

DIS Breakout BullishNYSE:DIS
DIS broke out of a descending pennant, deep retest on the resistance line, then bounced today, and finally held and closed above entry.
DIS has been taking it's time, but it's setting up to fly!
Considerations:
Disney Cruise Line hold up/reopen?
Disney Theme Parks Reopen
Disney Plus weak subscriptions, Marvel popularity


DISNEY downside continued!DIS in continued downtrend. has bounced strong off support before, but the downside looks more likely if ER doesn't kill.

DIS Daily Looks ReadyNYSE:DIS broke the down trend line and looks ready to take off.
It gave a small retracement bar today which gives us a perfect spot for an entry at $180.09
The stop loss should be under the local low at $170.31
The profit target is the ATH at $203
Risk/Reward Ratio of 2.3 could be better but good enough with this clean of a chart.

$DIS the range is getting thighterDisney has been playing around the 0.236 retracement for almost two months. On Friday it broke out of the wedge and maybe will start running to the next meaningful level at 186


DISNEY (DIS) - WAVE FORECASTDisney has achieved a logical target for this corrective movement. In the chart, however, a slightly bearish H&S formation can be seen, which should be observed in my opinion. 166 USD is crucial: A break below that level would activate 2 more targets to the downside: 155 or (144). That would be a perfect entry. On the other hand, this formation can dissolve very easily. That would also correlate with my bullish view for the overall market. Important for this is a break of the 183.39 level. Then disney can attack the ath again + i see targets around 225 USD.

Inverse Head and Shoulder patternWe are consolidating at the moment, but it looks like we are about to make another leg up.
Price failed to stay below the S1 Pivot and got back even above the P-Pivot.
Price currently sits at the most important resistance, which makes this the fourth trend-line touch.
We also have an inverse Head and Shoulder pattern, which is also a bullish sign.
If we don't have any huge gap-down in the broad market, then we will break-out.

DISDisney broke this resistance then retested. Currently holding a doji candle. Aug 20 180Calls at 3.8
