Setup: ETRETR : I have a swing trade setup signal. I'm looking to enter long if the stock can manage to CLOSE above the last candle high(BUY). If triggered, I will then place a stop-loss below (SL) and a price target above it(TP= Sell all or 50%, move SL to breakeven), then using the close below the 10SMA as
27,441.99
0.01 BRL
5.72 B BRL
64.04 B BRL
About Entergy Corporation
Sector
Industry
CEO
Andrew S. Marsh
Website
Headquarters
New Orleans
Founded
1913
ISIN
BRE1TRBDR003
FIGI
BBG00R4Z69H4
Entergy Corp. is a holding company, which engages in providing electric and natural gas services. It operates through the Utility, and Parent and Other segments. The Utility segment includes the generation, transmission, distribution, and sale of electric power in portions of Arkansas, Mississippi, Texas, and Louisiana. The Parent and Other segment refers to the parent company, Entergy Corporation, and other business activities. The company was founded by Harvey Couch on November 13, 1913 and is headquartered in New Orleans, LA.

ETR crossed monthly supplyEntergy Corporation (ETR) crossed monthly supply.
XLU (Utilities ETF) is also trending up with daily resistance which I expect XLU will cross tomorrow morning.

ATR: move downside potential?A price action below 93.00 supports a bearish trend direction.
Increase short exposure for a break below 91.00.
The target price is set at 88.00.
The stop-loss price is set at 96.00.
Remain in a declining channel pattern, whereby lower highs and lower lows are applicbale.


$ETR with a Bullish outlook following its earnings #Stocks The PEAD projected a Bullish outlook for $ETR after a Negative over reaction following its earnings release placing the stock in drift C with an expected accuracy of 66.67%.

ETR: back to its 200-day sma?A price action below 119.00 supports a bearish trend direction.
Crossing above this level will negate the bearish stance.
Possible M-top pattern busy unfolding?
Further bearish trend support below 119.50?
Consolidation price range from 116.00 to 118.00
Crossing below 116.00 might target 114.00.
Cros

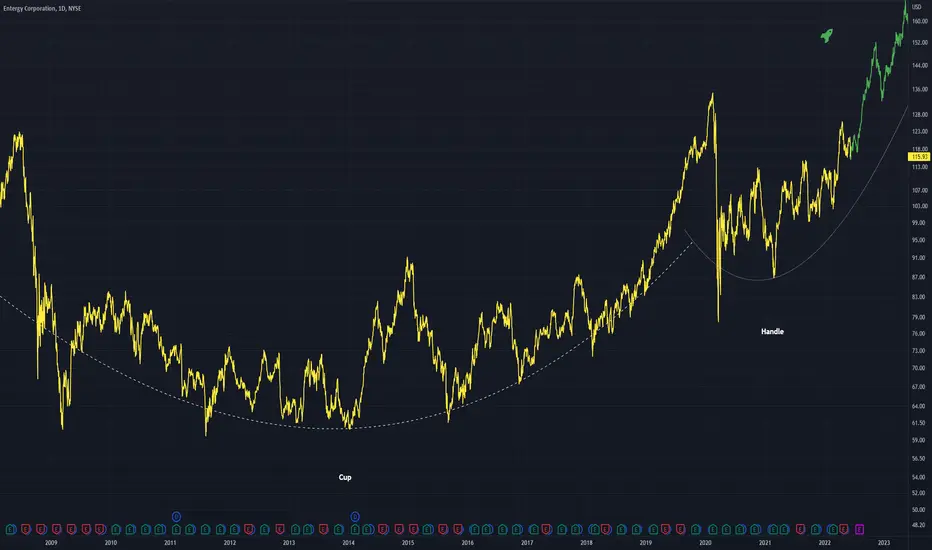
ETR - A Nice Cup and Handle Pattern A classic cup and handle pattern formation
This formation loves to break out to the upside after complete formation
Triangle Play that I missed...This was on a watchlist I created for triangle breakouts, but I forgot to set an ALERT. I got busy watching other things and making other lists. This would have paid nicely after the break.
Lesson Learned... The alerts are there to help you! SET AN ALERT & make money.
Lesson Learned.. If your worki

ETR BreakoutETR Break out of 17 Month Long Ascending Triangle
Recent dips held by 200 DMA
Breakout happened with high volume
Pays out Dividends


See all ideas
Summarizing what the indicators are suggesting.
Oscillators
Neutral
SellBuy
Strong sellStrong buy
Strong sellSellNeutralBuyStrong buy
Oscillators
Neutral
SellBuy
Strong sellStrong buy
Strong sellSellNeutralBuyStrong buy
Summary
Neutral
SellBuy
Strong sellStrong buy
Strong sellSellNeutralBuyStrong buy
Summary
Neutral
SellBuy
Strong sellStrong buy
Strong sellSellNeutralBuyStrong buy
Summary
Neutral
SellBuy
Strong sellStrong buy
Strong sellSellNeutralBuyStrong buy
Moving Averages
Neutral
SellBuy
Strong sellStrong buy
Strong sellSellNeutralBuyStrong buy
Moving Averages
Neutral
SellBuy
Strong sellStrong buy
Strong sellSellNeutralBuyStrong buy
Displays a symbol's price movements over previous years to identify recurring trends.