ENPH Earnings Trade Setup – JULY 22, 2025
🔋 ENPH Earnings Trade Setup – JULY 22, 2025
🌘 Enphase Energy: Oversold or More Pain Ahead? Bearish Setup in Play
⸻
📉 1. FUNDAMENTALS SNAPSHOT
📈 Revenue Growth: +35.2% (TTM) – strong, but…
❌ Recent EPS Misses: -3.17%, -15.21% → Poor execution
💥 Margins:
• Net: 10.4%
• EBITDA: 15.9% → Compression risk
⚠️ Guidance: Inconsistent + failed beat/raise trend
📉 Goldman Sachs PT: $32 (Bearish downgrade)
🧠 Fundamental Score: 5/10 – Fast growth, but fading sentiment
⸻
📉 2. OPTIONS FLOW SNAPSHOT
📍 Key Activity: Bearish flow near ATM puts
📊 Implied Volatility: Elevated → IV crush expected
📉 Put/Call Skew: Heavily skewed toward puts
📉 Sector: Solar weakness + rising rates + policy risk
📟 Options Flow Score: 6/10 – Caution dominates
⸻
📉 3. TECHNICAL SETUP
📉 Price: $39.66 (Below 20D: $40.88, 50D: $42.51)
📊 Volume: 1.23x avg, mostly on red days = Selling pressure
📉 RSI: 33.9 → Weak momentum, possible breakdown
📍 Support: $39.00 📍 Resistance: $43.00
📈 Technical Score: 4/10 – Weak setup into earnings
⸻
🧭 4. MACRO & SECTOR OUTLOOK
🌞 Solar Sector: Under pressure → higher rates + uncertain subsidies
🧯 Market Sentiment: Turning defensive on growth
📉 Macro Score: 5/10 – Long-term potential, short-term pain
⸻
🎯 DIRECTIONAL BIAS:
🔻 Moderate Bearish – 75% Confidence
→ Recent analyst downgrades, bearish flow, poor guidance history, and a weak chart setup signal downside risk
⸻
🔻 TRADE IDEA
🔹 BUY $39 Put exp. 07/25 @ $1.02
🎯 Target: $3.60+ → Stock < $35.50
⚠️ Stop Loss: $0.51
📅 Entry: Pre-Earnings Close (Jul 22, AMC)
💰 RR Ratio: ~3.5:1 → High leverage, tightly controlled risk
⸻
🔐 RISK PLAN
💼 Position Size: 1 contract
📉 Max Risk: $1.02 (Premium only)
🎯 Target Gain: +250%
⏱️ Exit Window: Within 2 hrs post-earnings to avoid theta + IV crush
⸻
🧬 TRADE DETAILS (JSON Format)
{
"instrument": "ENPH",
"direction": "put",
"strike": 39.00,
"expiry": "2025-07-25",
"confidence": 75,
"profit_target": 3.60,
"stop_loss": 0.51,
"size": 1,
"entry_price": 1.02,
"entry_timing": "pre_earnings_close",
"earnings_date": "2025-07-22",
"earnings_time": "AMC",
"expected_move": -5.0,
"iv_rank": 0.75,
"signal_publish_time": "2025-07-22 14:57:55 UTC-04:00"
}
⸻
#ENPH #EarningsPlay #PutOptions #SolarStocks #OptionsTrading #ENPHBearish #VolatilitySetup #TradingViewReady
E2NP34 trade ideas

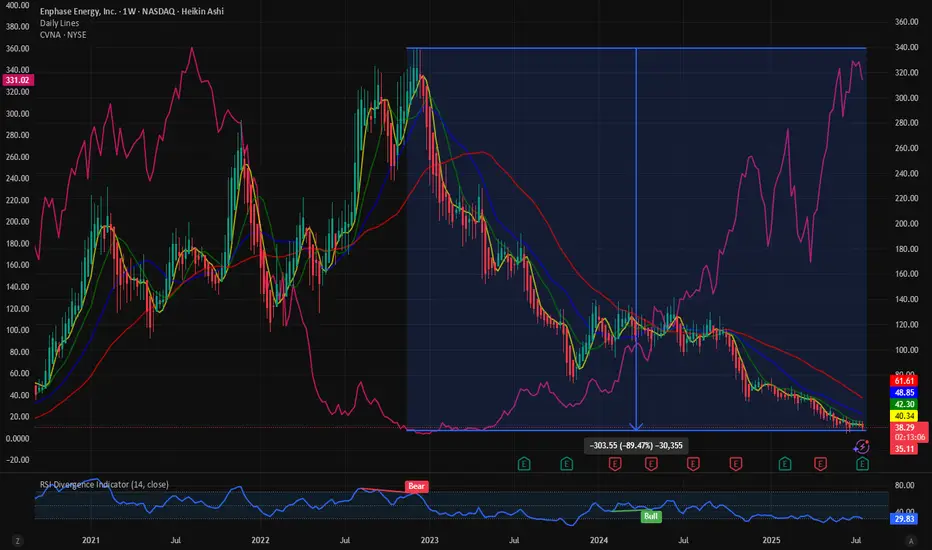
$ENPH:Clean energy stock and messy chart. Short squeeze incomingThe clean energy stocks are in a serious drawdown. NASDAQ:ENPH has a very messy stock. The stock has seen almost 88% of its value wiped out over the last 2 years. But is it the end of clean energy and stocks? With the new administration in place the clean energy stock has been in a bearish pattern.
In terms of the drawdown the stock looks the same as $CVNA. At its lowest NYSE:CVNA had 98% drawdown. NASDAQ:ENPH is down 90% and maybe it must go through a similar drawdown then the price must drop down to 10$.
Currently 21% of the NASDAQ:ENPH shares are sold short, and the short interest ratio is 3.77. These numbers indicate that there might be a danger of short squeeze with 21% of the shares sold short and it might take 4 days for the shorts to cover the positions. This is more than the current short squeeze candidate $OPEN. But is this a good time to buy?
In my opinion the price of NASDAQ:ENPH has some more room to downside. Out target is with price between 20$ - 10$ we can go long NASDAQ:ENPH
Verdict: More downside possible in $ENPH. Go long between 20$ -10 $. 21% Short interest.
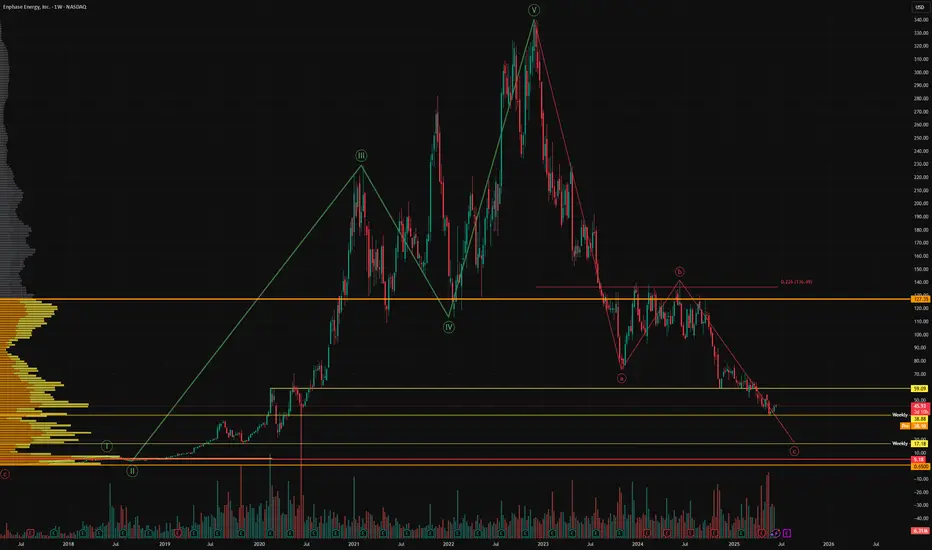
The last leg down?Enphase is holding on for it's life here, if support is lost then we could be heading towards my final target of $17-20. This stock has been a disaster. We had a 5 wave move up, then an abc correction. We are still in the final leg of wave c, nobody knows where it will end.
I have kept an eye on the stock, i'm certainly not trying to be too smart catching this falling knife. The downtrend was compounded last night by the news I was long anticipating - the administration is withdrawing tax credits for the industry.
Whilst this indeed a highly volatile stock that shows no strength of reversing trend, I may swing trade this stock once the sellers are exhausted. There is a need for energy in the AI era, solar will not disappear and this maximum fear scenario may soon present an opportunity.
Not financial advice, do what's best for you.
Jade Lizard Trade Idea for a 6/20 ExpirationNASDAQ:ENPH , Jade Lizard Trade
+1 $44 Call 6/20 Buy
-1 $43 Call 6/20 Sell
-{share price: $60.45}-
-1 $35 Put 6/20 Sell
Credit to open: ~$200
IF assigned on short put, then you own 100 shares @ an avg cost of $33/share.
IF the share price is at or above $44/share on 6/20 @ close, then profit is ~$100.
IF the share price is between $35 and $43 on 6/20 @ close, then profit is ~$200 .

$enph looks bottomed Using the Gann chart from the last lows till the high in 22'. It looks like it found support at the gann arc

Looking long for ENPH a possible leap! OptionsMastery:
🔉Sound on!🔉
📣Make sure to watch fullscreen!📣
Thank you as always for watching my videos. I hope that you learned something very educational! Please feel free to like, share, and comment on this post. Remember only risk what you are willing to lose. Trading is very risky but it can change your life!

Expect ENPH breakout by EOY 2025. Buy <$60Trends:
- LT parallel channel shown marks some key trendlines for the company since IPO
- LT falling wedge intersects the bottom of this channel H2 2025 --> a buying opportunity above $50. If that breaks, falling wedge ends around $35, a 30% downside (or 40% vs today's price).
- The early 2023 peak aligned with peak in revenue and net income (decline matched stock decline). We're now seeing revenue and net income growth again (growth can bring back stock growth)
My Bias:
I'm a long-term believer in solar. ENPH plays mostly in the residential solar space (and is expanding into small commercial). They are often lauded for their high levels of customer service.
Investment Thesis:
We're back to financial growth but the stock is down. We're in a few months window before LT trends converge mid / H2 2025. If we break bullish from falling wedge and hit LOWEST point of parallel channel by EOY 2026, we'd be at $70/share (16% upside from $60; 40% upside from $50). This is my expected worst case scenario, meaning anything under $60/share is now a buying opportunity.

Enphase power and Amazon comparison from 1999
The similarities are very striking from Amazon's IPO into the 1999 Dot Com speculative bubble and the bust afterwards. History could be repeating itself. This is the EV/Solar bubble. The tech revolution is already played out. Now the S curve will be solar panels on everyone's homes and commercial buildings. The big buying opportunity could be coming.


Enphase Pivots to Upside. ENPHAn interesting fractal picture here. A very flat AB=CD here with a triple drive inside that is bullish. Now looking to the upside. VZO, vWAP, US crossed, BB%PCT heading to the zero line. Kennedy channeling gives some stationary goals.

ENPH time to turn around?It is a difficult one and not confirmed yet, but if we are lucky we could have a double bottom from here. Needs to be monitored.

4 Years of DeclineWith the highs of February and March 2020 and the May close of the same year we'd got a temporary high that may become a support now. This has been tested already in the past November and in January this year. Now we are testing it a third time. If not broken this month we may have seen a firm bottom now.
The corrective potential is immense.

ENPHEnphase is a solar energy producer currently sitting at the all time .886 retrace of the 2022 highs.
The chart is showing a larger time scale completion of a 5 year large harmonic M-shape structure and locally another at the pattern completion zone.
I think this could be a good entry point for a longer term macro position trade.
Enjoy < 3

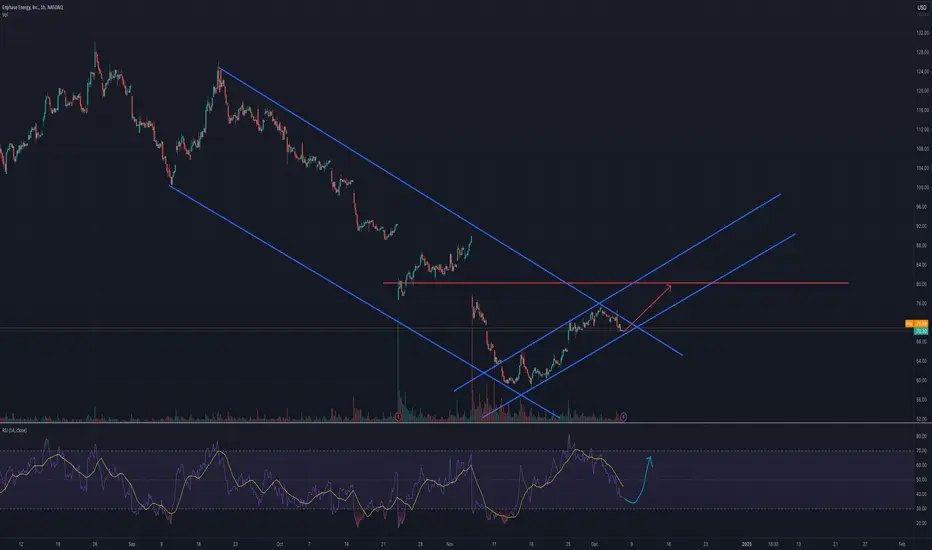
ENPH bullish setupEnphase has a presented a solid bullish setup with 2 impulsive moves that retraced to their respective 0.618 fib level, and a breakout of the descending trendline.
A long can be taken now with a stop loss at $68.50 and price targets at $90, $100 and $115, the last being the mid point of the large consolidation range on the monthly timeframe.

ENPH LONG SIGNAL (12/16/2024Tradeplan on ENPH 12/16/2024
ENPH ON BULLISH NOTE BACKTEST GAP ON 1H
BOUNCE WITH MILD VOLUME
Looking forward see bounce on fvg on intra day section to confirm bullish trade on ENPH.
Entry:$73.32
Stoploss:$72
Target: $82.01

ENPH Break up higher after violatile sectionENPH sweep through zone $72 then push higher now. Solar sector looks bullish

ENPH to $80?
Will the christmas rally enable ENPH to go back up towards $80? Given the downward trajectory of the stock price, there is not much belief in ENPH. However, it looks like it could bottom out at this level around $70. If that is the case, there will be some clear resistance at around $80 where quite a bit of volume entered but it would mean a 14%+ move from current level. IV% does not look fantastic, options not very cheap, but still something to track ones it starts moving.
ENPHThis stock has experienced an 83% decline since all time highs, but there could be a good chance here for people to make an investment. A pattern is reveling itself on a weekly time frame and under the same 52 week window, represented by the red horizontal lines.
52 weeks
RSI and price action is at the same point as 2015-2016
Stock is 83% down from ATH
As shown before in this pattern, there is a chance it goes slightly
This is not financial advise, I am not a financial advisor. Please only use this as a form of reference and awareness of market moves.

Enphase Energy, Inc. | Chart & Forecast SummaryKey Indicators On Trade Set Up In General
1. Push Set Up
2. Range Set up
3. Break & Retest Set Up
Notes On Session
# Enphase Energy, Inc.
- Support=0 | 012345 | Wave Template
- Retracement 1 | 0.382
- Retracement 2 | 0.618
- Awaiting Target | Intraday
Active Sessions On Relevant Range & Elemented Probabilities;
London(Upwards) - NYC(Downwards)
Conclusion | Trade Plan Execution & Risk Management On Demand;
Overall Consensus | Buy

EnPh Bottom is in it seems like. Neckline is 66$ if we can get above that and confirm this should see 72 soon

$ENPH with a bearish outlook following its earnings #StocksThe PEAD projected a bearish outlook for NASDAQ:ENPH after a negative over reaction following its earnings release placing the stock in drift C with an expected accuracy of 66.67%.

