EXAS - getting into my buy rangeI'd say low to mid $80s is a buy. Horizontal support meets up with the long term trend line. They just did a $850 million convertible note offering and Mr Market is giving us a 9% discount today.
E2XA34 trade ideas

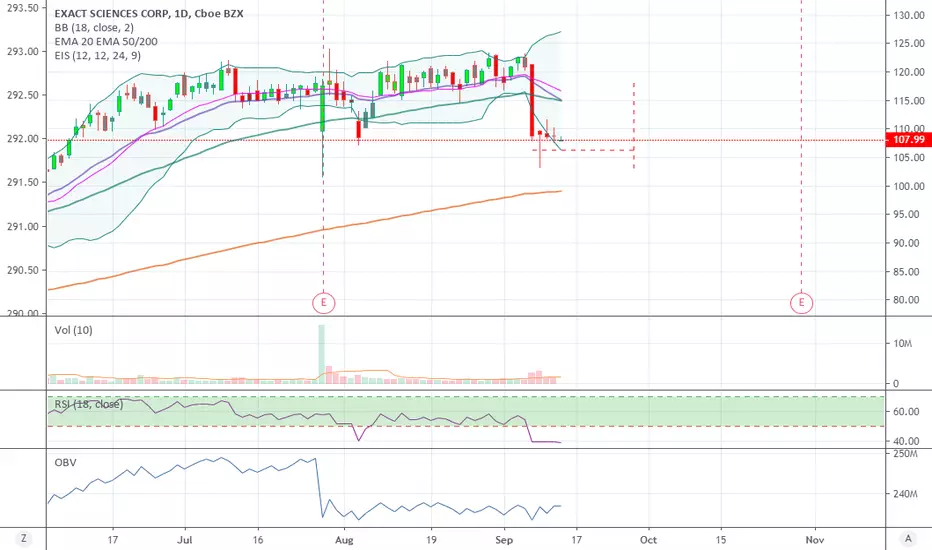
Exact Sciences Gap fill trade
Possible entry level $100
Upside target $103.63
Average analysts price target $123 - Buy rating
EXACT Sciences Corp. is a molecular diagnostics company, which focuses on the early detection and prevention of colorectal cancer. It developed Cologuard, a screening test for the early detection of colorectal cancer and pre-cancer. The company was founded on February 10, 1995 and is headquartered in Madison, WI.

EXAS - Bullish ModePrice created a nice inverted head and shoulders pattern aiming for the recent highs
as long as price is above 100$ it's very bullish
very nice upside potential here

Long-Term Buy opportunityChart and trend analysis:
Monthly timeframe - up
Weekly timeframe - up
Daily timeframe - up
Hourly timeframe - side
Trade action:
Long-term opportunity - BUY
Short-term opportunity - SELL
Important points:
1] Both, buy or sell zones have 2 price levels, color-coded for your understanding: Green (enter a trade), Red (exit the trade or stop-loss)
2] Your choice of buying or selling depends on your timeframe (long term wealth investor vs. short term income trader).
3] Follow our T4 strategy when the price reaches the zone: wait for a bullish and bearish reversal in buy and sell zones respectively.
4] Risk management strategies are critical in any trading or investing activity such as position size (how much to invest) or stop-loss (knowing when to exit with an acceptable, predefined, minimal loss).
Visit us to learn more: www.usstockadvisor.com


EXAS - Double-Bottom Bullish DivergenceThe stock price broke down from its consolidation in September which dated back to early June. The price has recently bounced off a similar low creating a double-bottom pattern. While this double-bottom was created a bullish divergence formed between the price & RSI indicator.
I would expect the price to continue rising & to eventually test the breakdown level around $106.50.

EXAS Swing trade shortEXAS gapped up and sold off trying a short 106/100 put spread 6 points wide
Price was $2.28 max gain is $1.86/ $4.14
Max loss is $1.70 taking the loss in the the Oct 14-20 if it goes sour.

Swing Trade EXASI'm trying a new strategy,
2 week trade. Sept 27 exp. Cost $1.89
108/103 Put Spread
Profit target is $217.70, Cost to cover is $122.85
2.31% of Capital. Good position.
Only downside is it could bounce as its not a bounce off the trend-line so its more risky in that manner however it could continue lower.

On the upper resistance lineBecause of the recent strong growth, the price looks like to wait to break the new high.
But, if we see the longtime moving, EXAS tends to growth below a resistance line.
Even in its best time 2017, the upper resistance worked well.
At that period, the lower resistance line seems to be 50MA.
However, even if we neglect the last large breaking, the lower resistance is a different line well below the 200MA.
When it touches those resistance lines, it could be the time to gain benefit from its strong growth.
Of course, it is possible to short until then if you want.
The analyst expectation of the price is still about 12 percent higher than the current one.


Bullish Deep CrabEXAS, place a buy limit order with a other cancels other order for the target/stop, still learning.
Buy order: 44.00
Target: 50.00
Stop: 43.00
Time Frame: Feb 20th

EXAS watchPlaying Trading Simulator Game:
On 17JAN18, had about 10 times the average trading volume!
Where will the price go from here?
I think it usually goes up.
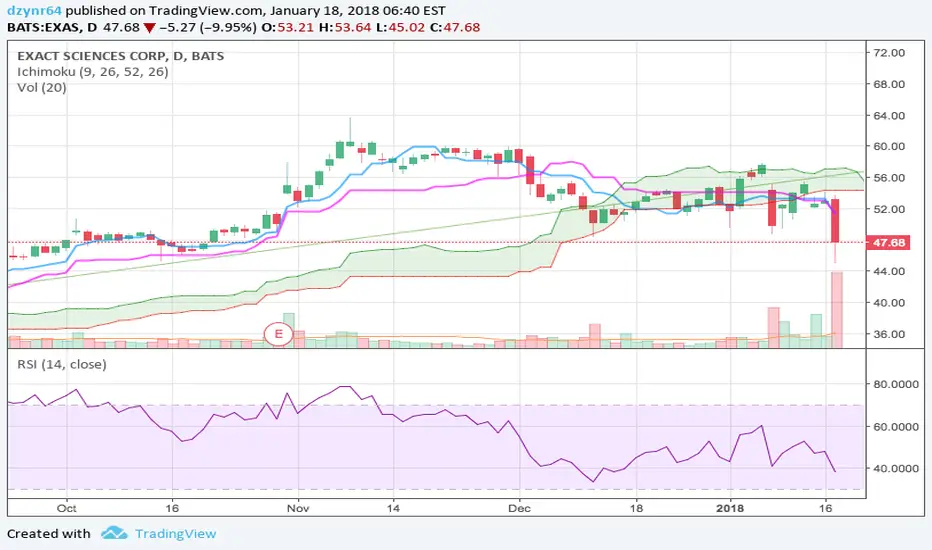
EXAS breaking down from big moveIf your in EXAS, I would go ahead and get out. It powered out of a nice rounding bottom to blast towards an unsustainable rate of ascent. On the daily chart it looks like it formed an eve and adam double top. Its formation is however, a little messy. I would cut gains and hope for a re-entry bounce at support. If you want to stay and wait, i would suggest raising your stops.
Weekly MACD pointing down and rate of ascent broken.
Monthly Stoch RSI breaking down.


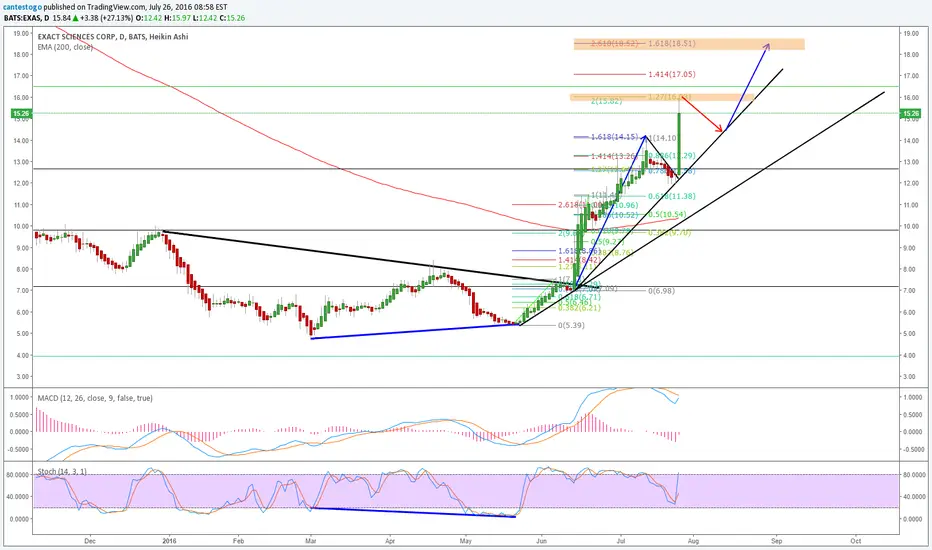
The Exact Sciences Stock Chart Suggests Higher PricesExact Sciences shares are trading firmly above the uptrend line, which suggests that higher prices are likely to continue. This bullish view is further supported by the golden cross that was generated in July 2016.
A golden cross is a bullish indicator that is produced when the faster 50-day moving average (highlighted in blue) crosses above the slower 200-day moving average (highlighted in red). This indicator is popular among investors because it is used to confirm that a bull market is development. This indicator was generated in July 2016, and there are no signs that this indicator will avert any time soon. This is because EXAS stock is currently trading above both moving averages that generated this bullish indicator.
In January 2017, a bullish MACD cross was generated, indicating that the bullish momentum was once again propelling Exact Sciences stock. The path of least resistance is now geared toward higher prices. This indicator effectively confirmed that the consolidation wave had concluded, and served to suggest that a new impulse wave was in development.

The Exact Sciences Stock Chart Suggests Higher PricesThe trend line acts as a line in the sand; trading above it means that a bull marker is still in development, and that, therefore, higher prices are expected to follow. Trading below this trend line would serve to suggest that a bullish move toward higher prices has concluded, and that a larger correction is set to ensue.
Exact Sciences shares are trading firmly above the uptrend line, which suggests that higher prices are likely to continue. This bullish view is further supported by the golden cross that was generated in July 2016.
In January 2017, a bullish MACD cross was generated, indicating that the bullish momentum was once again propelling Exact Sciences stock. The path of least resistance is now geared toward higher prices. This indicator effectively confirmed that the consolidation wave had concluded, and served to suggest that a new impulse wave was in development.

EXAS pullback buy after ERmay be buying long EXAS at 50% retrace from close before earnings at 21.80

Missed short at 22.3Damn I missed this short opportunity. I had this red line drawn and was waiting for it. Missed the alert somehow :(
I'll short on any pops here.


$EXAS short - sell sell sellThe post-EPS rally in this medical test/lab company is over. Big gap to fill and total loss of momentum here on the channel break.

EXAS POSSIBLE UPTREND CONTINUATIONAfter the breakout of the long term downward trendline Exas is making higher highs and higher lows, with a possible uptrend continuation. Every strong breakout of the rising trendline can change the trend with a deeper correction.
Potential Breakout @EXASNO signs of aggressive bullish pattern,,,yet.
Possible breakout when price hits resistance
Get in Get out QUICK!
