EAIN34 trade ideas


EA: Looking For Shorts On Bull Failed Momentum #ElectronicArtsTraders,
We have a lovely set up here, currently orbiting around the distribution zone. After a failed bull hike, the bears are settling in nicely and I think a down move will occur from this level with a high probability now.
Best of luck
Tom
NOTE- For today only, there is MASSIVE SAVINGS ON MY PERSONALIZED TUITION AND MY SIGNALS PACKAGES. For today only, you can get up to 80% off! Message me here on Trading view, or email me using the email address on my trading view profile page. This offer of 80% is only available TODAY so get involved!
Thank you.

EA: Demand Should Heighten At This Key Level #ElectronicArtsTraders,
We have a lovely set up here, currently orbiting around the distribution zone, we need to decide on direction. I am happy to pinch the longs, and the technical set up presented here gives you a good opportunity to buy on demand.
-We hit major moving average support
-We saw demand characteristics when we hit this technical level
-We are still seated firmly in distribution and buying here likely puts in line with the current trend paradigm
-We can tight SL due to the trend we have here.
NOTE- For today only, there is MASSIVE SAVINGS ON MY PERSONALIZED TUITION AND MY SIGNALS PACKAGES. For today only, you can get up to 80% off! Message me here on Trading view, or email me using the email address on my trading view profile page. This offer of 80% is only available TODAY so get involved if you want to trade like a professional!
Thank you.


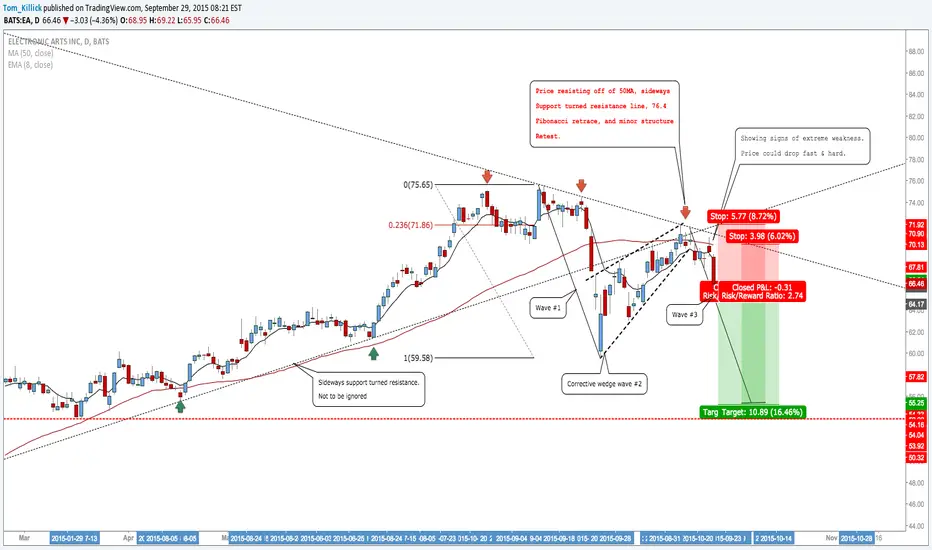
EA: Shorts Likely Off Action Level, Possible Correction ScenarioTraders,
Looks like a nice short off of key levels. Liking the simultaneous sideways support turned resistance, and the 50MA, are acting the same as each other, as it serves as extra confirmation. Lots of levels to serve as evidence for possible down move.
A technical correction, testing the 50MA, could bring us into downtrend territory for longer periods of time.
We'll see.
Theres 3 SL models here
1)TP@ extension+SL at the high of recent highs- Very non aggressive traders (1.89 RR)
2)TP@ extension+SL at 50MA+recent high- Conservative entries (2.74RR)
Best of luck,
Tom
Rolling Option Calls Well I've held some calls for some time now that are nearing expiration so I'm looking to roll them over instead of taking profits on them for my overall longer term bullishness on this company. Also, we have had some good press releases for EA come out this weekend on Seeking Alpha and another article arguing the "bull case" for the company in Barron's the previous week. So I'm comfortably long the company and looking to roll my calls with price targets for some profit taking being $65 and $70. I grabbed $70 as a price target from previous resistance dating a couple months back (I'll attach a screen shot of the monthly chart). Do note that its a slow grind up so patience is required as you can be bouncing between the "red / green P/L" for a while before going solidly into profit on the trade do make sure to pick your expiration's wisely if your a shorter term options player.
Short Term Resistance: $63.05/.38
Cheers =)

EA finding resistance at 2007 highEA has been in a good uptrend since 2012 and I have often looked at it during this time. However, it is susceptible to deep pullbacks so has never been worth serious consideration.
More recently (since the October 2014 low) a more reliable trend has begun to develop. The daily 50sma is now working well as support. Gaps up also have been corresponding with earnings announcements.
Unfortunately there is resistance ahead. Yesterday's gap up was a bearish reversal bar (a shooting star) which closed below the 2007 high ($61.62). The next major resistance beyond this is the 2005 high of $71.16.
If it were not for these two price obstacles I would consider a small risk buy - but far safer is to wait for the break above $71.16. By then a clearer trend structure should be visible - either as confirmation of a good trend or not. So EA is a stock to reconsider if price breaks the 2005 high.

EA Day Trade Gap N Go (Brad Reed May6,2015)If EA gaps above 60.63 consider using the Gap N Go strategy. To obtain a complete free stock trading education go to www.RealLifeTrading.com

EA: Looking To Go Long On Obvious Bullish SentimentFriends,
EA is long term bullish. We have a nice opportunity to jump on with the enthusiasm in a low risk way.
Main notes on chart.
Kind regards.
Tom


EA Day Trade Perfect Gap N Go (Brad Reed Jan28,2015)EA expected to open at 50.74 for a Perfect Gap N Go. To learn this strategy for free go to www.RealLifeTrading.com

Electronic Arts - EA - Daily - Top formation - Overbot Hidden Level Resistance just over $37 and my RgMov "trend indicator" says EA is in a downtrend. EA is overbought in CCI and turning back down below +100.
Target $34 and under $33. Be willing to sell up to $37.20 from $36.17 last.
Tim
3:47PM Friday, August 15, 2014 36.17 last
*** Hidden Resistance is available in the "Marketplace Add-on" in the Indicators Section so that the green "key hidden support" lines will draw automatically on your chart. Monthly and annual subscriptions are available.


C&H on the works!! cup is complete, working on a nice handleWith price target(s) on confirmed Break out!! all jmho

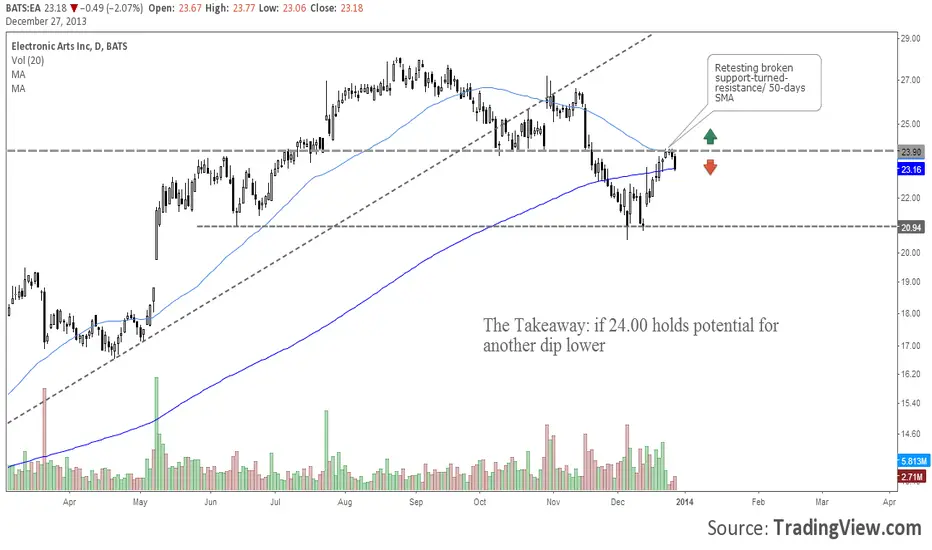
EA Retesting Broken SupportShares retesting the broken 24.00 support area, may form a short term resistance. Potential for another dip lower so long as this area is holding.