EBAY Day Trade Perfect Gap N Go (Brad Reed Jan22,2015)EBAY expected to open at 54.79 for a Perfect Gap N Go. To learn to trade this strategy for free, go to www.RealLifeTrading.com
EBAY34 trade ideas


Ebay - At sell zoneEbay has been trading sideways for a long time and has provided some great trades
I have traded Ebay only from the long side until now, this is my first short on it. The entry and stop loss levels are taken from my trading platform. The only worry I have is that the previous candle, a closing Marubozu, happened during the New Year's Eve, which is a pointless day for taking signals. However, the bearish divergence on the histogram is still there, and so is the false breakout. These two signals, combined with candle confirmation, when at buy/sell zone have produced fantastic trades.

$EBAY short idea $EBAY held under $57,50 resistance for several months until a fake breakout came in February 2014(zoom out far enough you'll see that price revisited the high set back in late 2004 at $59,21) and has been unable to make higher highs since. The week of October 13th painted a new low on the chart and was the first lower low since December 2012. We saw a 4 week relief rally back into channel resistance, however as price was rising, volume was declining. To add to the storm, last weeks price action painted a lovely shooting star reversal candle right near channel resistance, which is in confluence with the .618 fib retracement. If this thing is looking to roll over, a nice low risk entry would be on the break of last weeks low at $54,23 which was tested today. If this level cracks, we may see $EBAY rollover and flush back into trendline support. Stay tuned folks!

Ebay Inc - EBAY - Daily - Where's the beef? No momentum...Rolling over from a small rally within a long, sideways consolidation.
EBAY is doing its best to grow into its valuation, but in the meantime it is up to $17 billion in sales to support is hefty $64 billion market cap. Unfortunately, this chart shows the latest period has brought earnings to a standstill, which certainly means that EBAY is going the way of Amazon and not making any profits.
I look for more downside, albeit slowly, as EBAY tries to generate earnings and revenue growth to help keep this stock "afloat".
Tim 11:11AM EST 52.10 last EBAY 9/22/2014


ebayanalyzing the weekly chart we can see that the prices are in a sideways trend (50-57.50) last week we have a candle of indecision (maximum 57.05 Closing 50.50) with high volumes then most likely in area 55/56 we can get a discount on first support of 52.50 where for another and also supported by the moving average of 21 periods and subsequently the other media 50

EBAYYou don't get this type of setups posted in advance @ sites like Stocktwits or Yahoo. Make $$$ here.


Ebay support from fib .618? Price action could move back within the channel due to current support from fib .618 level.

Who Will Win Bulls vs BearsOne thing is very clear, the market helped the bulls to hold the fight longer than many thought, but bears never give up forcing range trade before the inevitably hits the street. If market corrects probably next few months, expect the bulls giving up. Will the bears regain control that they were forced to give up after same fight from end of 2010 to early of 2012 that was not only brutal but also sickening now seems their time is not that far unless bulls come up a different strategy that can convince the rest to stay way from another trap. If u want some residual income, buy the game by buying the lower part of the channel and selling at upper channel so far this was the best trading method on this stock. Stay safe. If u like it follow us for more like this


"ebay"ebay has $ 50.00 a massive chart technical buy signal is generated (double bottom) and is expected to rebound in the coming days at the top - the first price target $ 60.00
In addition, Citigroup ebay was one of the 10 interesting blue chips included with the most upside potential, fundamentally undervalued cheap at a PE of 15.

Ebay - still longI got stopped out on my ebay trade, but my bullish bias still stands. I will enter long again Monday. Trade is explained in the linked chart.

Ebay Long Entry OpportunityBounce off support yesterday brings a safe entry opportunity for Ebay at a good support level. Any institutions which are long this stock should be buying up more at these levels; otherwise, capitulation will ensue. I would look for at least a retest of 52.00. We have some bullish momentum divergence on the histogram and stochastic, and with the markets taking a noticeable breather today, Ebay is holding some buying pressure. One would want to keep stops fairly tight, but give it some room to come back and retest actual lows from 11-26. I would think stops around $46 should be enough and still give you a nice Risk/Reward ratio.

EBAY broke down of major supporteBay broke down major support at $50 and closed on dead lows at $49.60 on Friday showing relative weakness as markets trading on highs.
Today, it opened with gap and caught some early follow through. Gap open could be new point of reference at $49.30, then we have $49.50 previous low of the day and then $50 psychological level which should act like resistance if sellers want to keep control on price.
I want to see few days of consolidation below, so then we can expect continuation move lower.
----------------------------------------------------------------------------------------------------------------------------------------------------------
Read my earlier thoughts on EBAY in the link below
----------------------------------------------------------------------------------------------------------------------------------------------------------

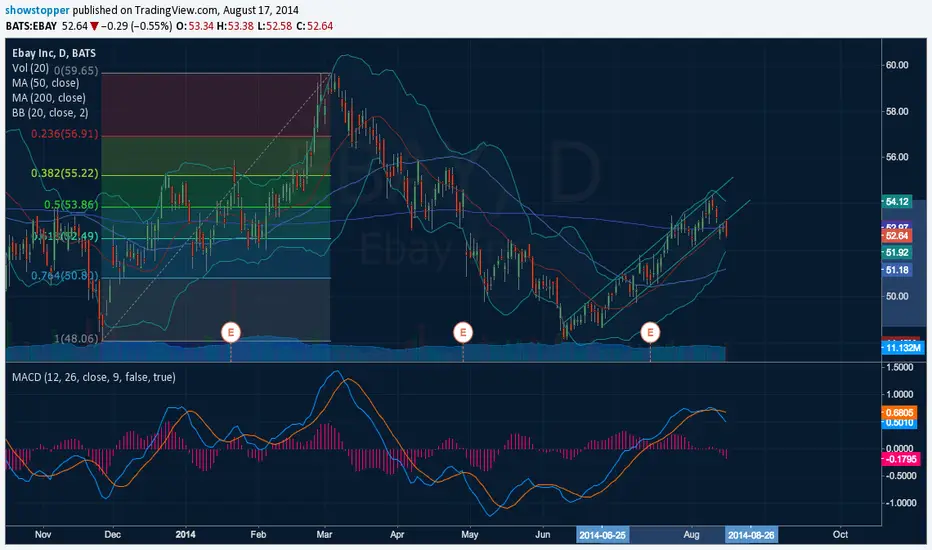
EBAY DIVERGINGEbay is deverging the stock is making highers highs while the indicators are making lower highs. I woudl suggest shorting when the 10 MA crosses the 21MA and the price breaks 0.236 zone. At this moment a stop loss should be placed at or a little above the blue line above the 0.236 ratio.
Hope this chart gives you a clear view of Ebay

Ebay - Double bottom at buy zoneEbay has been trading sideways for a very long time. This is not the first trade on Ebay, check out the linked chart.
Everytime Ebay approaches the 50$ level, it's time to buy. When I first published this trade, there were some negative comments on how Ebay is bearish and I shouldn't buy. Well, the story is simple, when price stands at 50$, buy, it's a good bet. At some point it will probably go way below 50, but until then, this is a good bet.
There is a double bottom at the buy zone, with a MACD histogram divergence, which is not yet completed, but it will soon be. There is a bullish divergence on the MACD lines, and bullish divergences on both FIs.
Tommorow, I'm going to wait 30 minutes after the open. Depending where we stand at that time, I will enter or I will wait. Allthough it's a clear signal, and I'm very confident in this trade, if you look back you can see how Ebay likes to whipsaw traders with false breakouts, and I'm trying to prevent this. Once long, my stop is 49.46, which is a bit more further away than my usual stops, but again, looking back at the reverseal points explains this. My first target is at 55$, and my second at 57$, but according to how ebay will act, I might take partial profits at 52.50.
I checked out the correlation between the overall market and Ebay, red lines represent start of declines, and blue lines represent start of rallies. Allthough it sometimes correlates with panics and surges, it is not that well correlated and even if the Dow will have a very nasty picture (I believe it's coming soon, I'm still waiting to pull the trigger) I will not close the entire position out. Chart here

EBAY heading into major supportEBAY is on my short list. As it trades below all key moving averages including the most important one 200 EMA, means that bears in control despite storng market and technology sector as well. Earlier it failed to hold above $58 (breakout point) and definitely it is not a good sign for buyers.
Ebay gapped down on earnings on 30th of April with pivot resistance at $52.75. bounced from major support at $50 which also acts like psychological level, but this bounce was really weak.
There are entries inside that range but for more confidence we need break down of $50 then I expect to see some follow through .
Next reasonable support is at $46 which could be my first target.

EBAY Ready for a Pop?I'd like to see some bullish Knoxville Divergence on EBAY, and then buy the sh*t out of it, or sell some puts, or buy a bull call spread. Also, I am looking for a new oboe teacher. Mine was abducted.
