Not Yet CorrectedAlmost 22% in 1 rush in 1 week is a lot. The window is wide open. Wether we may close it is in the stars. But an attemptto do so may be well expected.
F1NI34 trade ideas

Cloud PenetratedThe drop was substantial today. Very often they are exaggerated and will correct.
The cloud is still rising. Mind that the present level where we seem to halt had been a critical one already almost exactly 1 year ago.

LONG FIS @ 85.50 - oversold in a falling wedge (maybe)NYSE:FIS is another decidedly unsexy and counterintuitive stock that I love to trade. It's pretty boring, except when it's not. It's in a year long uptrend so that alone is attractive. That falling wedge referenced in the title isn't particularly relevant to MY trade thesis but maybe it would be sexy for some of you.
For me it is about being oversold and what this stock has been doing when it is. Over the past 12 months, it would have produced 18 oversold trade signals. Unsurprisingly for me, all 18 would have been profitable trades. What is most compelling for me, though, is that the longest any of them would have taken to become profitable is 6 trading days, with the average being 2.27 days using FPC.
I didn't bother to calculate the average win exactly, but 4 of the trades were over 1%, 2 were over 3%, and one was over 5% - and those were all one day trades. When all you have to do to beat the market long term is average >.042% per day, this trade is a no-brainer for me.
All the 11 other trades could have been just 0.1% gainers (they weren't) and it would still be an average of over 1% per trade and at 2.27 days/trade we are talking an average gain per day of at LEAST .44% or 10x the average day in the market as a whole. Sign me up again and again and again for that. .44% per day is 111% per year, in case you were wondering.
As always, I'll add whenever it's oversold and with FPC, I'll sell any lot at the close of the first day it becomes profitable. This isn't trading advice - DYOR. It is merely one man's musings on how I might make money in the coming days faster than the market as a whole while risking far less than having all my money parked there. Follow in my footsteps at your own risk, but if you do, I wish you luck.

Fidelity National launches climate risk assessment modelFidelity National Information Services Inc., a renowned financial services and outsourcing solutions provider, recently unveiled a new product to address climate risk assessment. As businesses grapple with the increasing uncertainty brought about by global climate change, Fidelity is positioning itself as a key player in the market for analytical tools.
Fidelity National’s newly introduced service, named the Climate Risk Financial Modeler, operates on a Software-as-a-Service (SaaS) subscription basis and is designed to assess risks associated with the physical assets of businesses and non-profit organisations. This tool is tailored for financial professionals seeking innovative methods to manage risk throughout the economic lifecycle.
Exploring potential trading opportunities, let’s review the technical analysis of Fidelity National Information Services Inc. (NYSE: FIS):
On the Daily (D1) timeframe, the stock has established a resistance level at 78.55 USD and support at 73.40 USD. The stock has been in an uptrend since the end of October 2023. If a downtrend begins, a potential downside target might be set at 60.10 USD.
However, if the current uptrend maintains its momentum and the stock price surpasses the resistance at 78.55 USD, there could be an opportunity to buy with a short-term target of 85.15 USD. For a medium-term investment strategy, the stock price might rise to 94.00 USD if the positive momentum continues.
__
Ideas and other content presented on this page should not be considered as guidance for trading or an investment advice. RoboMarkets bears no responsibility for trading results based on trading opinions described in these analytical reviews.
The material presented and the information contained herein is for information purposes only and in no way should be considered as the provision of investment advice for the purposes of Investment Firms Law L. 87(I)/2017 of the Republic of Cyprus or any other form of personal advice or recommendation, which relates to certain types of transactions with certain types of financial instruments.
Risk Warning: CFDs are complex instruments and come with a high risk of losing money rapidly due to leverage. 69.88% of retail investor accounts lose money when trading CFDs with this provider. You should consider whether you understand how CFDs work and whether you can afford to take the high risk of losing your money.

Fidelity ,,, Buy opportunity Uptrend
Trading on Pullback has several benefits such as setting a small SL and trading in the direction of trend.
As you see, it has been a pullback to the broken level and there is a good bullish candle as trigger for entry to buying position by offering a sl at about 73.

Fidelity Matrix with harmonic coneIn a taylorist expansion trend, the shaded area represents the 1.2 : .8 estimated strike targets. From which a Diamond appears. UNLESS fundamentals fail and the stock experiences a 0 02 % SD move. Can begin setting parameters for potential strikes with higher probability.

Looking extremely bullish on FIS.Thank you as always for watching my video! Please feel free to like, share, and comment on this video!

$FIS Ready for Base Breakout?NYSE:FIS has been forming a base for about a year. I like how it is above the 50 DMA and all other shorter term Moving Averages. It is, however, still below an 18-month AVWAP (meaning that going back 18 months, stockholders by price and volume are slightly underwater). That may be an area of overhead resistance. It is under the 40 Week MA which can also be a source of overhead supply.
I have an alert set on the horizontal area of resistance. Should that trigger, I will go to a lower timeframe to determine a good risk reward entry with a reasonably tight stop.
Ideas, not investing / trading advice. Comments always welcome. Thanks for looking.
FIS is a leading provider of technology solutions for merchants, banks, and capital markets firms globally. Our employees are dedicated to advancing the way the world pays, banks, and invests by applying our scale, deep expertise, and data-driven insights.

$FIS Bearish Parallel Trend Line BreakNYSE:FIS : The stock has recently experienced a break in its bearish parallel trend line, signaling a reversal from bullish to bearish. Given this technical shift, we are now turning our stance to buying positions in $FIS.

FintechDaily IndexFintechDaily Index with a collection of publicly traded companies representing banking, securities and insurance technology industries.

FIS - Holding breakoutI've been in FIS since Jul 5 and the follow-through action has been disappointing to say the least. Still, FIS is holding the breakout and finding support around the $58.25 area and now has the ascending 9ema caught up.
On the M5 there's a clear, well-established descending TL in place and FIS finally broke above it and got some FT in the last few minutes of trading. I'm looking for continuation with an initial price target of $64.
I lose full interest on any close < $58.

April Gainers (FIS, account up 0.16%)9th trade in April is NYSE:FIS .
Holding period is 35 days (3/13/23-4/17/23).
Account is up 0.16%.
Total return in April is 1.81%

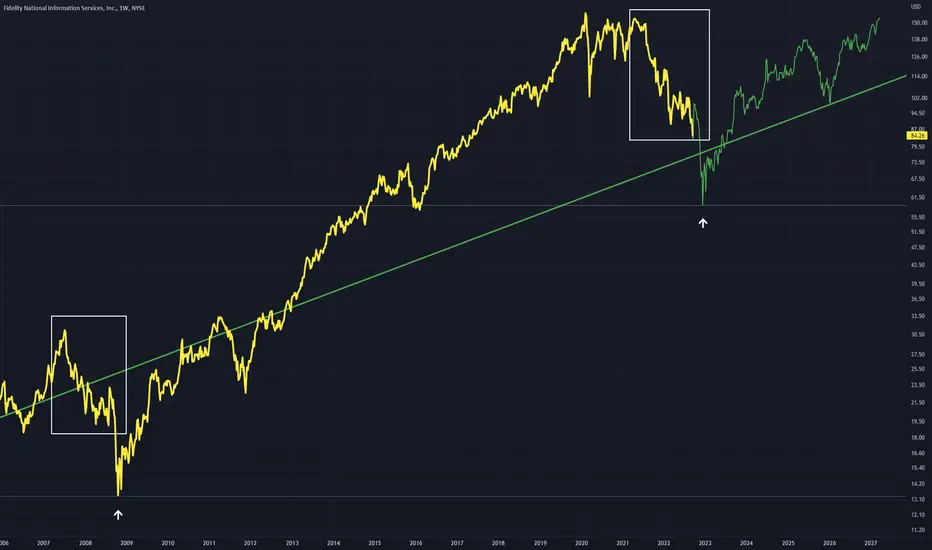
FIS - Similar Downward Structures If these downward periods are comparable FIS is in for a very sharp yet brief drop
From here price will lead to a recovery and maintain this green trend line
Downward structures in white boxes
FIS - Breakdown Below 200MA The 200MA throughout the course of this stocks history has been seen as a point of strong support
Recently however on this 3D chart, price has broken down below the 200MA, something that hasn't been seen before
Coupled with this 200MA breakdown a Strong Double Top formation is present, cementing the bearish assumption
The green trend line is where I think support will eventually be found

$FIS with a Bullish outlook following its earnings #Stocks The PEAD projected a Bullish outlook for $FIS after a Positive Under reaction following its earnings release placing the stock in drift A with an expected accuracy of 60%.

$FIS with a Bearish outlook following its earnings #Stocks The PEAD projected a Bearish outlook for $FIS after a Negative Under reaction following its earnings release placing the stock in drift D with an expected accuracy of 60%.
FIS: Breakout of the range.The range resistance level could be broken upwards with the minimum target level around 190.


$FIS with a Bearish outlook following its earnings #Stocks The PEAD projected a Bearish outlook for $FIS after a Negative Under reaction following its earnings release placing the stock in drift D with an expected accuracy of 50%.
If you would like to see the Drift for another stock please message us. Also click on the Like Button if this was useful and follow us or join us.

FIS in resistance rangeFIS has been able to continue an uptrend for some time, I'm looking at a strong resistance area that could push the stock back down to its major support line. If the price can reach 158, then there's a very high probability that we will see a reversal. I do not recommend entering a trade right, be patient, and let's see how the stock moves.

$FIS with a Bullish outlook following its earnings #Stocks The PEAD projected a Bullish outlook for $FIS after a Negative over reaction following its earnings release placing the stock in drift C
If you would like to see the Drift for another stock please message us. Also click on the Like Button if this was useful and follow us or join us.

FIS Reversal Head and ShouldersReversal head and shoulders pattern has formed on FIS. FIS looks good from both a technical and intrinsic value standpoint IMO.
