copper cup for fcx.. setting up before earnings week.lets see how this goes. these patterns are so funny. seems they work out about 2% of the time... maybe this is it?
Can find a bunch of these cups as you look through your favorite names. Bet they all break the same way, at same time. Will be interesting to see what puts the next move in motion.
Good luck out there!
FCXO34 trade ideas

Our Stock of the day / FCX LongToday we have a long set up to share:
a) The price is inside an ascending channel (purple line) and has been bouncing inside that range since APRIL.
b) Currently, we can see a corrective structure that has been formed after a bounce on the ascending channel.
c) If we zoom in on the chart, we can see a clear range (support and resistance) in which the price is on it.
d) The corrective structure we can see is completed, and we expect a bullish movement if the price reaches our Entry level.
e) Our Break Even level will be the yellow line. Stop and Take Profit are the ones explained in the chart.
f) We will take this trade using a 1% risk of our capital.
g) We will cancel the trade if the price stays below the corrective structure OR if the risk-reward ratio is less than 1.5
h) Remember: Trade safe, protect your capital, and always understand what you are doing and the risk involved.

FCX reversal upY1>Y2 = weak downtrend
got power up
CDE = T1<T2
fib @ 1.618
W&R success = reversal up
It is a weak downtrend with no power down. Fibonacci hit up, not hit down.
W&R succeeded. Trend is about the reverse up. With Pattern C at the bottom.
TP @ 31.84
SL @ 8.50

Long FCX ( $GLD $FCX #GOLD $GC1! $GC_F $Spy $GOLD $XME)see full chart at www.tradingview.com
FCX
Entry $15
Target 1 $17
Target 2 $20
stoploss $13
Why?
Why it is a buy?
Stimulus bill #2 will eventually come out by 2021, Along with FOMC mentioning that they will allow inflation to run wild. what that means is that, the fundamental value of GOLD and other minerals will increase in price. While everyone is focus on gold, and silver, they are missing out on Copper. so I think it is defiantly an laggard and we could catch a nice buying opportunity still.
Who are they?
Freeport-McMoRan, Inc. engages in the mining of copper, gold, and molybdenum. It operates through the following segments: North America Copper Mines; South America Mining; Indonesia Mining; Molybdenum Mines; Rod and Refining; Atlantic Copper Smelting and Refining; and Corporate, Other, and Eliminations. The North America Copper Mines segment operates open-pit copper mines in Morenci, Bagdad, Safford, Sierrita and Miami in Arizona; and Chino and Tyrone in New Mexico. The South America Mining segment includes Cerro Verde in Peru and El Abra in Chile. The Indonesia Mining segment handles the operations of Grasberg minerals district that produces copper concentrate that contains significant quantities of gold and silver. The Molybdenum Mines segment includes the Henderson underground mine and Climax open-pit mine, both in Colorado. The Rod and Refining segment consists of copper conversion facilities located in North America, and includes a refinery, rod mills, and a specialty copper products facility. The Atlantic Copper Smelting and Refining segment smelts and refines copper concentrate and markets refined copper and precious metals in slimes. The Corporate, Other, and Eliminations segment consists of other mining and eliminations, oil and gas operations, and other corporate and elimination items. The company was founded by James R. Moffett on November 10, 1987 and is headquartered in Phoenix, AZ.

FCX in correlation with XLB DividendHistorically NYSE:FCX has been bearish the week of or week leading into AMEX:XLB dividend. Shown here is its support and resistance, movement this summer, along with selloff in correlation to XLB dividend dating back to Dec 20, 2019. Materials and metals have popped this year with AMEX:GLD taking charge earlier this summer. FCX has beat earnings expectations all year and that if that trend could continue FCX could see more upside. After a strong finish to the week, I like FCX for to make a quick turnaround going into October along with SLV and other materials, as I believe can still serve as a strong hedge as we near elections.

fcx vs aapl vs amzn same path. lower hi's, hi'r lo's .. wedgeconcerning breakdown on fcx this week. Maybe bit of comfort seeing aapl, and amzn have a similar patterns? Thought was worth a note..

UPDATE FCXSo we got the reject at the resistance that I indicated in my previous analysis.
Now we have to be patient and wait for a clear setup for entry.
Short term behaviour can be a quick retest of the small resistance just up ahead and then continuation of the downward trend (orange).
Or back up to start some sort of top formation (like a head and shoulders, double top, rising wedge, etc).
What we need to look for is 2 things:
- Arrival at a significant level of support.
- Signs of reversal at this support like; bullish divergence, engulfing candles, large wicks, big volume on bounce, falling wedge, inverted head and shoulder, etc.
The 3 supports to look out for:
1. The area around 14.00 marked with the first green circle. From a horizontal support perspective this is a very strong area (see W chart, not shown here). Also is the 0.618 fib of the latest impulse (blue fib lines). So very much an area to look at!
2. Area around 11.00-11.50. There is a confluence of things going on there: The 0.5 fib, strong horizontal support and a possible retest of the previously broken downward trendline (blue).
3. Area around 9.00-9.5. Seems unlikely, but I've marked it nontheless as it represents the 0.618 fib and another horizontal support.
So let's keep a close eye on the price action once arriving at these support levels. Getting close to no. 1 already, which could very well be the turning point already.

FCX - Technicals + Fundamentals lining upHigh probabilty trade here. On the technical side the FCX chart is showing a bullish ascending triangle, whilst on the fundamental side FCX's primary product both copper and gold continue to be very bullish . Should be some tailwinds with recent market volatility and possible rotation over the next little bit as well.

Rallying despite the Nasdaq, S&P 500, Dow Jones correction #1Soo, I have searched for some Tickers that gives steady gains, despite the downturn of the major indexes.
The first one is, Freeport Inc.
As you can see it broke the "R1 Pivot Point" resistance with relatively high volume. If it manages to stay above it, then I will buy some calls.
If it goes lower than R1, then I would wait a bit and then go long on it. Entry zone for such a case: 15.67
Check out my profile for other tickers like this one.

FCX - A Multitude of Technical PatternsFCX appears to be reverting to historical inflation trends. Double Bottom, V - Shaped, and Inflation Adjusted Trends all appear to be present.
Copper is showing strength as well. Watch Supply/Demand. See notes on chart.

FCX getting near resistance, time to sell?So FCX has been on an incredible run, so the question becomes when is a good time to sell and wait for a possible retrace.
We are currently getting close to a confluence of resistances, so I wanted to highlight this as a possible good selling point.
First of all there is the long term downward trendline that is currently around 17.5-18 (depending on how you draw it).
Then there is a long term high resistance area coming up just above as well.
My money is on FCX being stopped in it's tracks at this level. It would at least give you a high probability cheaper entry after selling.
And finally, looking for a buying entry after retrace I see 2 scenarios:
GREEN: We simply consolidate for a while before breaking the trendline and continuing up.
ORANGE: We do a retrace to the 0.5 (or 0.618) fib and we retest the previously broken trendline.


FCX setting up nicely in cyclical turnaroundLong term 2W chart approaching key level. Breakout above $16 could indicate further upside potential. 20 and 50 week MAs provide some support w/ 50 wk turning up

Posible retroceso rupturaLos indicadores indican posible ruptura alcista siguiendo el canal ascendente semanal.
Pero hay posible retroceso a soporte anterior si no rompe la media de 200 y sigue con el patrón bajista de los últimos triángulos bajista.s

$FCX ends 6 year bear market - short term bull target is $16Whether or not the tech bubble pops, precious metals will continue to rise. $FCX is a safe low risk long term hold. Watch for Copper futures to quickly trade above $3.

All that glitters, is not goldAfter being decimated over the last 10 years, it seems that FCX, is rising from the ashes. Given its exposure to several metals, and the recent push higher in both precious and base metals this could be a very handsome investment. Technically looking good. Tomorrow is earnings.

C&H Earnings BMOCup and Handle
Mid Cup 9.25
stop below handle low at 12.5
Targets 16.5 19 20.5
Not a recommendation

FCXcopper mines galore, electric cars, turbines.... gotta be careful if they outlaw gold, what be the next haven? Blue sky volume ahead


fcxpotential buy stock
Freeport-McMoRan Inc. engages in the mining of mineral properties in North America, South America, and Indonesia. The company primarily explores for copper, gold, molybdenum, silver, and other metals, as well as oil and gas. Its assets include the Grasberg minerals district in Indonesia; Morenci, Bagdad, Safford, Sierrita, and Miami in Arizona; Tyrone and Chino in New Mexico; and Henderson and Climax in Colorado, North America, as well as Cerro Verde in Peru and El Abra in Chile. The company also operates a portfolio of oil and gas properties primarily located in offshore California and the Gulf of Mexico. As of December 31, 2019, it estimated consolidated recoverable proven and probable mineral reserves totaled 116 billion pounds of copper, 29.6 million ounces of gold, and 3.58 billion pounds of molybdenum, as well as operated approximately 210 wells. The company was formerly known as Freeport-McMoRan Copper & Gold Inc. and changed its name to Freeport-McMoRan Inc. in July 2014. Freeport-McMoRan Inc. was founded in 1987 and is headquartered in Phoenix, Arizona.

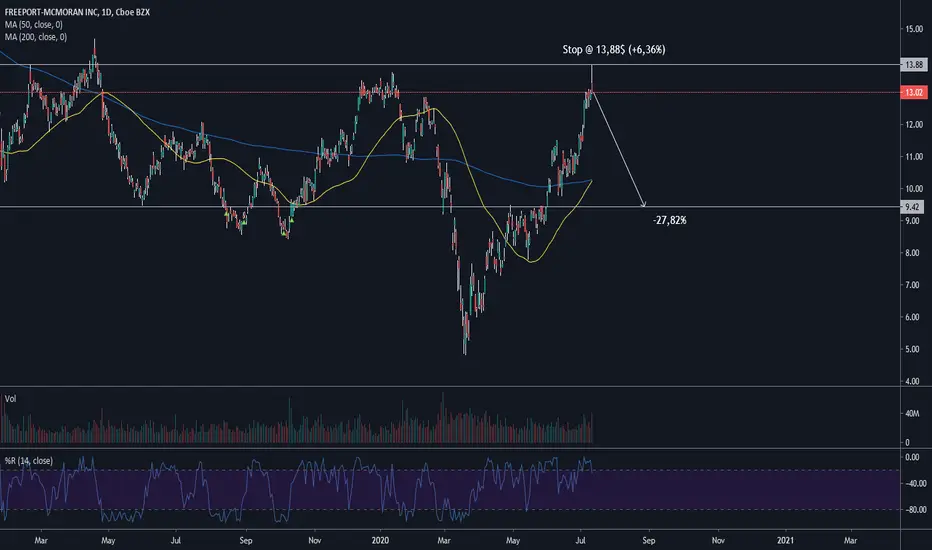
SHORT FCXExpecting short-term correction from extremely overbought weekly and daily levels. If stop breached, be prepared to catch new daily reversal on higher levels with a tight stop.

$FCX Freeport Bullish as Copper Surges
Possible trade setup on break above trendline resistance.
Upside Target $14.50 to Fibonacci and Pivot point .
Copper prices continue to surge and we may see
some rotation into the sector.
PLEASE GIVE US A LIKE IF YOU FIND OUR CONTENT HELPFUL, THANK YOU.
