GOOGL charted for 18MarNot at all looking forward to playing GOOGL up or down. Charting this for the reps.
GOGL34 trade ideas


GOOG is ready for bear pullback?GOOG, after breaking down from a long-lasting channel price, found support at the 200-day MA and bounced off it.
It bounced right toward the line where the breakout occurred, which is often a pretty normal move.
Yesterday, the price formed a shooting star reversal pattern, indicating a high possibility of creating the Bear Pullback pattern, a very powerful pattern. I'll enter and explain where I'll personally have the entry point and why, as well as where the stop loss will be.
In this trade ill risk 400$. Here is my risk management.
Yesterday High was 142,19 and low 140,01, there fore price range for yesterday was 2,18$
STEPS:
1. Set Entry Price:
Below the closed candle’s low
1/8 of that candle’s trading range - 1/8 x $2.18= 0.2725
Range price calculation ----- H 142,19 minus L 140,01 = 2.18 is range
2. Use a Stop/Limit Order
Stop (trigger) = 1/8 below low. L 140,01 minus 0.2725 = 139,73
Limit = 5-10 cents less than stop price. 139,63
3. Attach Initial Stop-Loss
Above candle’s high by ¼ of the “trading range” - 1/4 $2.18 = 0.545
Manage based on last candle or moving avg. or S/R lines.
Stop loss will be at H 142,19 plus 0.545 = 142,74
4. Risk per share = Stop loss - Entry.
142,74 - 139,73 = 3,01 per share
Based on 400$ at risk ill buy 400/3.01= 132 shares for this trade possibilities

just adding to the googljust adding to the googl, this is what i charted before i overlayed the bollingers and sma's

GOOGL with extra sauceSo thru alot of trial and error and the help from a few wonderful people, i discovered i can see bollinger band and simple moving average trends in the candles. im long googl to 160. next thing to learn is how long it will take to get there. stay tuned

GOOGL - More room to the downside! Easy short to look out for!We will need to see tapering under our magenta buying channel which failed to pick up price. And if we see that throughout the day today, I will look for either a rejection from our strong selling green (on the daily) or our more tapered selling teal (which is strong selling on the weekly).
Keep an eye out for these and join my livestream at market open to see how I look for and take my trades.
Happy Trading :)

$GOOGL - Potential wedge breakout?NASDAQ:GOOGL The chart looks tempting for a long position with a potential wedge breakout and MACD crossing.
If the bullish scenario plays out, it can reach $150 in the near term.
The ideal entry area for bulls would be $127 - $119. 👀
GOOGL Too Woke to Enter the AI Race Yet !!If you haven`t bought the dip on GOOGL:
Then you should know the recent controversy surrounding Google's Gemini AI was sparked by a viral post revealing an image generated by the tool. This image depicted the U.S. Founding Fathers, inaccurately featuring a black man.
The incident raised concerns about the AI's historical accuracy, prompting discussions about the precision and reliability of Google's Gemini AI image generator.
Gemini faced criticism for producing images of German soldiers from World War Two that deviated from historical accuracy by featuring a black man and an Asian woman.
The AI stated that there was "no right or wrong answer" when comparing Elon Musk posting memes to the actions of historical figures like Hitler.
Gemini firmly rejected the idea of misgendering a high-profile trans woman, Caitlin Jenner, even in a hypothetical scenario involving a nuclear apocalypse.
These instances of over-politicized responses have raised questions about the nuanced understanding of ethical dilemmas within the AI system.
The controversy surrounding Gemini prompted Google to promptly pause the tool and issue an apology, acknowledging that improvements were needed to align the tool with ethical standards.
I expect to see some significant resignations at Google soon!
My price target for GOOGL for the next 2 months is $130.

GOOG In Buy ZonePerception:
Despite the recent fall in Google and Apple's shares, I think it is a pullback and a bargain buying opportunity.
Technicals:
Daily Chart
First pullback after all time high reached.
RSI at extremes and other indicators.
a-b-c completion
61.8% fib retracement zone.
No stage 3 bear market in Google
Weekly Chart:
Weekly chart has not confirmed the potential risk of a daily end of up trend.
Comment: Buy more with a 0.1% risk

Googl immediate buy for a swing trade.Thank you as always for watching my analysis. Please feel free to like, share, and comment on this video!

Google ReloadedAfter reaching the top of its bullish channel in late Jan, Google traded downward and is now just below the bottom line. If this can get back into its channel, this will rip. No divergence on the Slow Stochastic or RSI and both are reloaded and pointing bullish.
Wait for GOOG to close inside channel and then go long.

GooglPrice is correcting back to 127 support... 127 is trendline support and price action support. Price is also showing a falling wedge here
I think if price can hold 127 the next stop is 160 or ATH..

Bullish on Mighty $GOOGNASDAQ:GOOG has formed a bullish trend channel starting from November 2023. Had a strong pull back last week but bounced back to maintain the bullish channel.
Great probability to retest the the previous resistance as it looks to soar to new all time highs.

$GOOGL trade ideaThis chart is interesting because as you can see NASDAQ:GOOGL has had a STRONG uptrend and continues to respect the trendline over time. on the other side we see that we have weakness in the near term and have breached the 50ema and the shorter term EMAs have crossed. If the trendline is broken we can look to short under $139, if we see a bounce materialize here and we break the immediate downward trendline then we can look to go long safely over $145.
Trade SAFE!

Buying opportunities on GOOGLE and APPLEInteresting! betterlow just detected a buying opportunity on a large tech stock yesterday on #Google at $132.56
Will it bounce back up like previous times? To be continued.
Same story on #Apple, betterlow just detected a good buying area yesterday at $169.12!
Previous dips were on point, will this time be different?

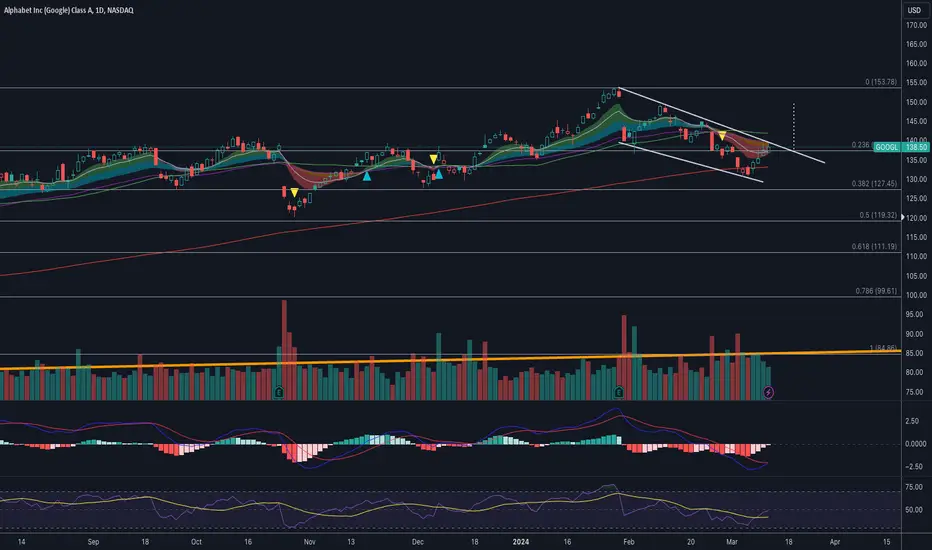
GOOGLE Stock Chart Fibonacci Analysis 030524Trading Idea
1) Find a FIBO slingshot
2) Check FIBO 61.80% level
3) Entry Point > 137/61.80%
Chart time frame : C
A) 15 min(1W-3M)
B) 1 hr(3M-6M)
C) 4 hr(6M-1year)
D) 1 day(1-3years)
Stock progress : B
A) Keep rising over 61.80% resistance
B) 61.80% resistance
C) Hit the bottom
D) Hit the top
Stocks rise as they rise from support and fall from resistance. Our goal is to find a low support point and enter. It can be referred to as buying at the pullback point. The pullback point can be found with a Fibonacci extension of 61.80%. This is a step to find entry level. 1) Find a triangle (Fibonacci Speed Fan Line) that connects the high (resistance) and low (support) points of the stock in progress, where it is continuously expressed as a Slingshot, 2) and create a Fibonacci extension level for the first rising wave from the start point of slingshot pattern.
When the current price goes over 61.80% level , that can be a good entry point, especially if the SMA 100 and 200 curves are gathered together at 61.80%, it is a very good entry point.
As a great help, tradingview provide these Fibonacci speed fan lines and extension levels with ease. So if you use the Fibonacci fan line, the extension level, and the SMA 100/200 curve well, you can find an entry point for the stock market. At least you have to enter at this low point to avoid trading failure, and if you are skilled at entering this low point, with fibonacci6180 technique, your reading skill to chart will be greatly improved.
If you want to do day trading, please set the time frame to 5 minutes or 15 minutes, and you will see many of the low point of rising stocks.
If want to prefer long term range trading, you can set the time frame to 1 hr or 1 day.

Google near support - contra tradeAlthough its advertising revenues was slightly below projections, Alphabet’s Q4 earnings and revenue beat analyst expectations.Google can test its resistance near 150 area and you can take stop loss 127 for short term and 120 for mid to long term view.
Entry 132
Stop loss 120
First Target 150

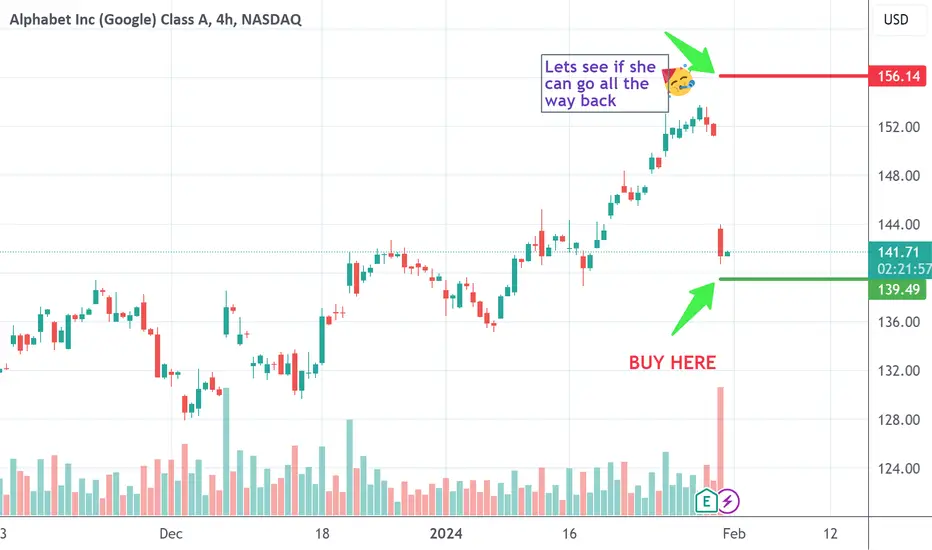
Update to GOOGL earnings ideaMy earnings practice idea is working out, but I never had an upside target.
GOOGL hasn't quite gotten to the lower targets, so there's still a chance that occurs, however, my dowsing work suggests it should go all the way back to where it traded before earnings, and I actually even have a new high for it and over a 10% move up.
This should occur by next Friday, however, I'm not super confident in my timing in the context of anticipating where price will be at or by a certain time.
So far it's decent though with the time of day for a low working well.
#GOOGGoogle start it impulsive wave from 13 Mar 2023 and complete a five wave on 16 oct 2023.
After that it form a flat correction with extended B wave . So the C wave should be end above the low of A wave .
Now you can long Google with 121$ in medium term 4-5 month for target 200$


Failed to stay on topGoogle cannot stabilize on the top and price falled down reaching bottom of current upside channel
Today price can bounce and close a candle above purple trendline as confirmation
Is it possible (but less probable) that price break current channel heading down to next resistace at 130$

GOOGLE on its 1day MA200 after almost 1 year! Strong buy!Google / GOOG hit today the 1day MA200 for the first time in 11 months (since March 30th 2023).
That makes it a strong technical buy opportunity, also taking into consideration that it did so near the bottom of the 14 month Channel Up.
This is so far a -14.50% decline from the Channel's top, which is the pull-back that the previous bearish wave did.
Buy and target $170.00, which would be a +28% rise, a common rally inside this Channel Up pattern.
Previous chart:
Follow us, like the idea and leave a comment below!!

$GOOGL Realistic pullback targetsNASDAQ:GOOGL Realistic pullback targets
I have found that, over the years, anticipating pullback targets from before a pullback starts can help you keep your cool once it does start. Being able to see realistic pullback targets is a superpower. This chart is only a little bit off from the last one I published which I will attach below.
If you are an ultra-long-term investor, any of these targets would be a great place to add on the way down…
And if you’re a trader then these will undoubtedly be levels where there may be more volatility and interest.
so the latest rally, the support for that is the red dotted line (the 35EMA weekly) and if that breaks their are some juicy targets to keep on your radar.
