Navigating Google's Strategic Shift: Job Cuts and AI Ambitions
In a move to streamline operations and cut costs, Google has recently announced significant layoffs across multiple teams, impacting its Voice Assistant, hardware division responsible for Pixel, Nest, and Fitbit, as well as the augmented reality (AR) team. Fitbit co-founders James Park and Eric Friedman are also leaving the company, marking a notable development since Google's acquisition of Fitbit for $2.1 billion in 2021.
The Tech Giant's Restructuring:
Google's spokesperson confirmed that the layoffs are part of a broader effort to enhance efficiency, align resources with product priorities, and adapt to the evolving tech landscape. While the spokesperson did not disclose specific numbers, reports indicate that hundreds of roles are affected, raising questions about the scale of the restructuring.
AI Ambitions and the Generative AI Trend:
The restructuring coincides with Google's ongoing investment in generative artificial intelligence (AI) technology. The company had previously announced plans to integrate generative AI capabilities into its virtual assistant, a move that aligns with industry trends following the success of OpenAI's ChatGPT. The growing focus on AI underscores Google's commitment to staying at the forefront of technological innovation.
Market Resilience Amidst Challenges:
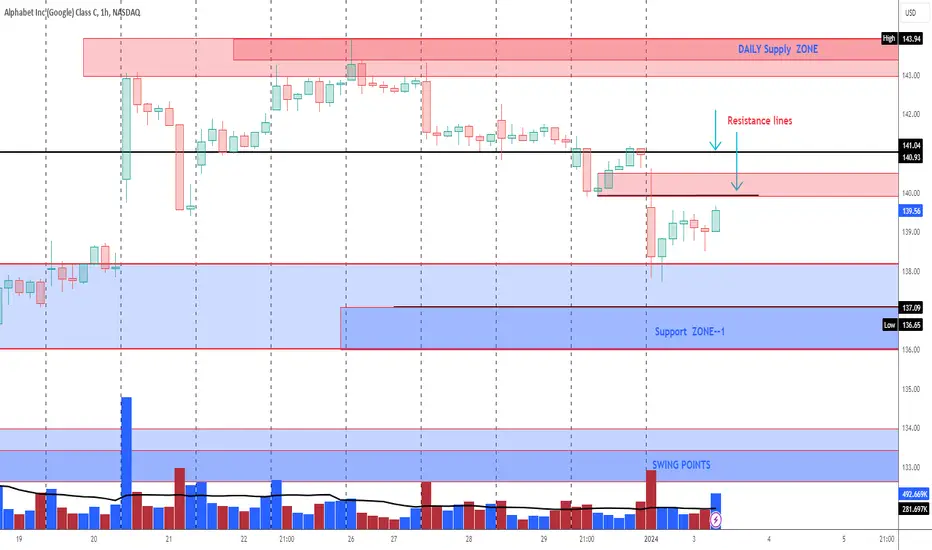
Despite the organizational changes and layoffs, Alphabet's technical analysis suggests a positive outlook. Alphabet C is currently in a rising trend channel in the medium to long term, indicating investor confidence. The stock has broken through resistance at $142, signaling potential for further growth. Additionally, NASDAQ:GOOG is trading near the top of its 52-week range and above its 200-day simple moving average, demonstrating market resilience and maintaining upward momentum.
Strategic Shifts in the Tech Landscape:
The restructuring efforts at Google are not isolated incidents in the tech industry. Major players like Microsoft have also been adapting to the changing landscape, with a focus on generative AI technology. The broader shift highlights the industry's ongoing evolution and the need for companies to remain agile in the face of emerging technologies and market dynamics.
Alphabet's Overall Workforce Impact:
The recent layoffs follow Alphabet's announcement in January 2023, detailing plans to cut 12,000 jobs, equivalent to 6% of its global workforce. As of September 2023, Alphabet had 182,381 employees globally. The strategic workforce reductions are part of Alphabet's broader strategy to optimize operations, enhance efficiency, and position itself for sustained growth.
Conclusion:
Google's recent organizational changes and workforce reductions reflect the company's commitment to adapting to the fast-paced tech landscape. Despite challenges, the positive technical analysis suggests investor confidence in Alphabet's strategic direction. As Google continues to invest in generative AI and reorganize its teams, the market will closely watch how these strategic shifts position the tech giant for future success in an ever-evolving industry.
GOGL34 trade ideas

$152 reject on the monthly.It’s failed to go above $152 twice on the monthly chart . So there will be resistance there. Could be another reject or a break out. I’ll play the reject and retest or break and retest

GOOGLCurrently, Google is in the buying zone, but if the red average indicated by the blue arrow is broken and we enter the green zone, the market will be in the selling phase.

GOOGL Daily Launch PadGOOGL has been riding the 50 EMA on the daily for quite some time. After the late October shakeout down to the 200 EMA, GOOGL has looked very strong and been trending upwards in this accumulation zone. A clean break above $141 should send this to test the high at $150 and beyond.

GOOG short term BullishAscending triangle nested within a giant rising wedge.
I think we're set up for one more bull run before completing the wedge and falling out.

EOY Review $GOOG strong year heading into exhaustion levelNASDAQ:GOOG
Magnificent 7 did great this year, GOOG included
strong close, 4 green quarters in a row
exhaustion risk -for what it's worth- around that 152 level
will be interesting to see how this level (and similar levels for the other big 6) will play any role in what the big guys/institutes will do here
let's watch and see, anything can happen, incl. big tech (check out '22)

Magnificent seven 🚀Monthly chart: magnificent seven
Impressive increase, with a performance of 125.48%
The year was rich for the American technology sector.
Good year ! 🚀

Unveiling the Synergy Between MAP Protocol and Google Cloud
In the fast-evolving landscape of technological advancements, a groundbreaking partnership has emerged that promises to redefine the intersection of blockchain and cloud computing. Google Cloud, a powerhouse in the tech industry, and MAP Protocol, a trailblazer in peer-to-peer interoperability, have joined forces to create a synergy that opens new frontiers for developers and investors alike.
The collaboration marks more than just a fleeting alliance; it lays the foundation for an ongoing technological revolution. A Google Cloud representative expressed genuine enthusiasm for the partnership, underscoring its pivotal role in driving technological progress. The integration of MAP Protocol's peer-to-peer interoperability with Google Cloud's robust infrastructure is poised to enhance accessibility to blockchain for developers of all levels, paving the way for a new era in decentralized solutions.
What sets this partnership apart is its strategic vision for the future. In the months to come, MAP Protocol plans to harness the cutting-edge technology offered by Google Cloud to elevate the Web3 developer experience. This forward-looking approach not only ensures continuous innovation but also positions NASDAQ:GOOGL as a frontrunner in shaping the landscape of decentralized technologies.
Investors keen on tapping into the future of technology have reason to be excited. Google Cloud's state-of-the-art technology is set to provide MAP Protocol with the tools needed to create a supportive and solidified builder experience. This, in turn, will facilitate a seamless transition from Web2 to Web3, placing NASDAQ:GOOGL at the forefront of the next wave of technological evolution.
The collaboration is strategically positioned to catalyze the growth of the Web3 industry, making decentralized blockchain technology more accessible to developers worldwide. The rising trend in Alphabet A stock prices underscores the positive sentiment among investors, indicating a strong buy interest. The stock, currently testing support at $140, presents a pivotal moment for investors. A positive reaction at this support level could signal an upward trajectory, aligning with the overall rising trend channel in the medium to long term.
Investors seeking to capitalize on positive developments and be part of the transformative journey into Web3 should take note. The MAP Protocol and Google Cloud collaboration positions NASDAQ:GOOGL as not just a stock but a gateway to the future of technology. With ongoing advancements and a commitment to enhancing the Web3 developer experience, Alphabet A stands as a compelling investment opportunity for those who recognize the potential of this groundbreaking partnership. As the collaboration unfolds, NASDAQ:GOOGL emerges as a beacon for investors looking to ride the wave of innovation in the tech industry.

Alphabet's ($GOOGL) Hit a 52-Week HighShares of Google-parent Alphabet ( NASDAQ:GOOGL ) hit a 52-week high Wednesday following reports of an impending shake-up in its core advertising business.
Sean Downey, who leads Google’s ad business in North and South America, said in a department-wide meeting that the company's 30,000-person ad sales unit would be reorganized, according to people familiar with the matter. He did not specify whether the changes would involve layoffs.
The reorganization comes as Alphabet leans on artificial intelligence to generate and place ads on Google, YouTube, and its other platforms. Alphabet generated $54.5 billion in revenue—or 80% of total revenue—from ad sales in the third quarter.
Generative artificial intelligence can be substantially cheaper than conventional methods for both ad creators and sellers. WPP, the world’s largest advertising firm, struck a deal with Nvidia in May to create an AI-enabled content development engine.
Google is paying to settle an antitrust lawsuit over its Google
Google recently agreed to pay $700 million to settle a landmark antitrust lawsuit it was facing, and $630 million of that amount will be set aside for payouts to consumers.
The settlement came after Google was accused of using its Google Play Store to dominate Android mobile apps as a monopoly and charge customers higher prices.
Lawyers estimate around 102 million people will be eligible to receive some of that money and a good chunk will even be automatically compensated — an estimated 70% of those fully eligible. That's about 71.4 million people.
Who is eligible for Google's settlement payout
Those who are eligible for payment are described as people who had a "legal address" in the US in their Google payment profile when they bought an app from the Google Play Store or made an in-app payment between Aug. 16, 2016 and Sept. 30, 2023, according to legal documents. The address could have been in any of the 50 states, the District of Columbia, Puerto Rico, or the US Virgin Islands.
Technical Analysis
$GOOGLE shows strong development within a rising trend channel in the medium long term. The company experiences positive development and buy interest among investors is increasing. $GOOGLE has broken a resistance level in the short term and given a positive signal for the short-term trading range.
The stock is testing resistance at dollar 140. This could give a negative reaction, but an upward breakthrough of dollar 140 means a positive signal.

GOOGLE: Bearish - BUTTERFLY 113 detectedGOOGLE: Bearish - BUTTERFLY 113 detected
The market may fall in the PRZ zone
Monitor the EMA.50 and EMA.200
as well as the Bollinger and ICHIMOKU bands


GOOG up?Nice looking classic accumulation pattern on the weekly chart.
Rejected bearish head and shoulders pattern on the daily, held the level.
Now probably looking to break the range 128-138 to the upside. If the market will continue to be favorable for bulls, of course.
We'll see...

2 scenarios for earningsCase 1: We are in wave B of an expanded flat, post earnings pop to 143-144 and then drop to 128 by 11/6
Case 2: Drop from current level (138) to 125-128 before 11/3 expiration
** The play **
- 2:1 puts to calls Nov 3 135 puts for 2.60 and Nov 3 142 calls for 2.80
- If case 1 plays out, sell the calls to break even and enter Nov 9 138 puts
Not financial advice

GOOG is consolidating and preparing for a major moveIt's in a rare diamond pattern and also a symmetrical triangle, maintaining consolidation within it for months. The breakout from this pattern is expected to be significant and rapid, either with a surge or a sharp drop, involving a considerable percentage change.
Three days ago, there have been attempts to break out with increased volume. However, the trendline appears robust, promptly rejecting any advances. It seems like a substantial catalyst is needed to break out of this pattern.
In my assessment, there is a 55% chance of a breakdown and a 45% chance of an upward breakout. This conclusion is drawn from its current position, situated below all major moving averages except the 200-day.
Regardless of the direction, a long or short trigger could be highly useful and powerful, offering a potential opportunity for easy profits.

Chart Patterns:3 Step Rocket Booster StrategyFeel free to rocket boost this content to learn more.
What is the best chart pattern to follow?
I was studying technical analysis and then i saw this on breaking news
about the Google stock going up.
Using the rocket booster i saw this stock last week.
I was testing the strategy to make sure it will work..
This strategy is valued at about $700 worth of trading losses.
And using it takes time to understand.
If you have no idea on how to stick to a strategy
you may end up selling a winning position.
The Rocket Booster Strategy:
#1- The price has to be above the 50 EMA
#2- The price has to be above the 200 EMA
#3- The 50 EMA should cross the 200 EMA
If you learn to stick to this strategy then you will be able to have confidence in your
trading journey and technical analysis.
Rocket boost this content to learn more
---
Trading signal: Buy
Stock:Google
Date:19/12/2023
---
**Disclaimer:**
The information provided above is for educational and informational purposes only.
It does not constitute financial advice, and trading always involves
--
a risk of substantial losses, regardless of the margin levels
used. Before engaging in any trading activities, it is crucial to
--
conduct thorough research, consider your financial situation,
and, if necessary, consult with a qualified financial advisor. Past
--
performance is not indicative of future results, and market
conditions can change rapidly. Trading decisions should be made
--
based on careful analysis and consideration of individual
circumstances. The user is solely responsible for any decisions made
--
and should be aware of the inherent risks associated with trading in
financial markets.

Google Cloud to Run Validator on Crypto Gaming Network XPLAGoogle Cloud will be the first “volunteer validator” on the XPLA gaming chain, adding to Google's growing list of crypto allies.
XPLA, a blockchain network founded by major South Korean game publisher Com2uS, has enlisted Google Cloud as its first “volunteer validator” for the network.
Blockchain validators verify and confirm transactions to support the network. In the case of XPLA, volunteer validators are not rewarded with tokens for supporting the network. Instead, the tokens are distributed to a community pool.
That's the plan, at least. The XPLA network is currently voting on the proposal to institute the volunteer validator feature, and it has 100% votes in favor as of this writing.
XPLA is built on Tendermint, the same protocol that powers the Cosmos network, and it’s also compatible with the Ethereum Virtual Machine. Notable games that run on XPLA include The Walking Dead: All-Stars, Summoner’s War: Chronicles, and Ace Fishing: Crew—all based on existing IP that has been adapted for “play-to-own” blockchain games.
The network was originally established as C2X and built on Terra, the network that lost considerable traction after the collapse of the UST and LUNA tokens in May 2022. The XPLA network was then launched in August 2022. Other XPLA validators include metaverse investor Animoca Brands and mobile game developer Gumi.
Google Cloud has previously signed on to run a validator on a few other blockchain networks, including Solana, Tezos, Aptos, Ethereum scaling network Polygon, and DeFi network Celo. It also collaborated with exchange Coinbase to accept cryptocurrency payments.
In April, Google Cloud launched its Web3 Startups Program to offer additional benefits for crypto firms in partnership with networks like Solana, Aptos, Near, and Hedera.

$GOOG Diamond top?Goog has a rare Diamond Top setting up in the next week or two we have an extreme downward turn or a 3rd Elliott Wave up

Google holds a favourable position in the AI competitionThe competition within the artificial intelligence industry continues. According to a report from Alphabet Inc., its proprietary product, the Gemini AI model, has demonstrated promising results compared to its competitors. It is reasonable to assume that increased competition will improve product quality, providing Google with every chance to capture a substantial share of this market.
So today, we suggest examining the Alphabet Inc. (NASDAQ: GOOGL) stock chart.
On the D1 timeframe, support formed at 120.21, with resistance at 139.36. A relatively wide channel has appeared on the chart, with a high probability of breaking its upper boundary. A significant support level is at 127.22.
On the H1 timeframe, a short-term target for the price increase can be set at 151.29, while in the medium term, it could hover around 165.
—
Ideas and other content presented on this page should not be considered as guidance for trading or an investment advice. RoboMarkets bears no responsibility for trading results based on trading opinions described in these analytical reviews.
The material presented and the information contained herein is for information purposes only and in no way should be considered as the provision of investment advice for the purposes of Investment Firms Law L. 87(I)/2017 of the Republic of Cyprus or any other form of personal advice or recommendation, which relates to certain types of transactions with certain types of financial instruments.
Risk Warning: CFDs are complex instruments and come with a high risk of losing money rapidly due to leverage. 67.85% of retail investor accounts lose money when trading CFDs with this provider. You should consider whether you understand how CFDs work and whether you can afford to take the high risk of losing your money.

Magnificent sevenDaily chart.
Comparison between Magnificent seven and S&P500.
Profit taking?
Make up your mind.

Google @134.22When you look at the chart NASDAQ:GOOG above you will notice
that The MACD indicator is red below
==
this shows maximum panic from the crowd
also a good time to buy from the bottom
==
Disclaimer: Remember this is not financial advice do not buy or sell
anything i recommend to you
==

GOOGLE: Strong buy for $155.Google opened today under the 1D MA50, neutral on its 1D technical outlook (RSI = 48.601, MACD = -0.240, ADX = 32.196). Through out 2023, a 1D RSI value below 50.000 has been a buy opportunity and even more so now that the price is near the bottom of the twelve month Channel Up. This consolidation during the last Bullish Leg of the Channel Up (April 6th - May 5th), was the last buy opportunity before the stock resumed the rise and peaked over the 1.618 Fibonacci level for a HH. We are buying again on GOOG, this time aiming over its All Time High, exactly on the 1.618 Fibonacci (TP = 155.00).
## If you like our free content follow our profile to get more daily ideas. ##
## Comments and likes are greatly appreciated. ##

📈 Google Analysis - A Conundrum! 🚀Our entry into Google was perfectly timed, thanks to the limit order. Now, we face the challenge after our subordinate 5-wave structure, where we completed Wave 1 with an abrupt Expanded Flat (a, b, c). The question arises: is this already Wave 2, or is it Wave ((a))? Currently, it appears to be a triple correction upward, specifically a Regular Flat.
Possibly, there might be a downward correction, perhaps to a Double Bottom around $128, the level of our entry. That would then finalize Wave 2. This scenario is possible, though not definitive. There could be another decline in Google in the coming days before it takes a decisive upward turn. 📈🚀
