GOOGL Approaching Inflection Point! Jul 30GOOGL Approaching Inflection Point! Will It Hold Above 195 or Break Down to 190? 🚨
GEX Options Sentiment Overview (1H Chart)
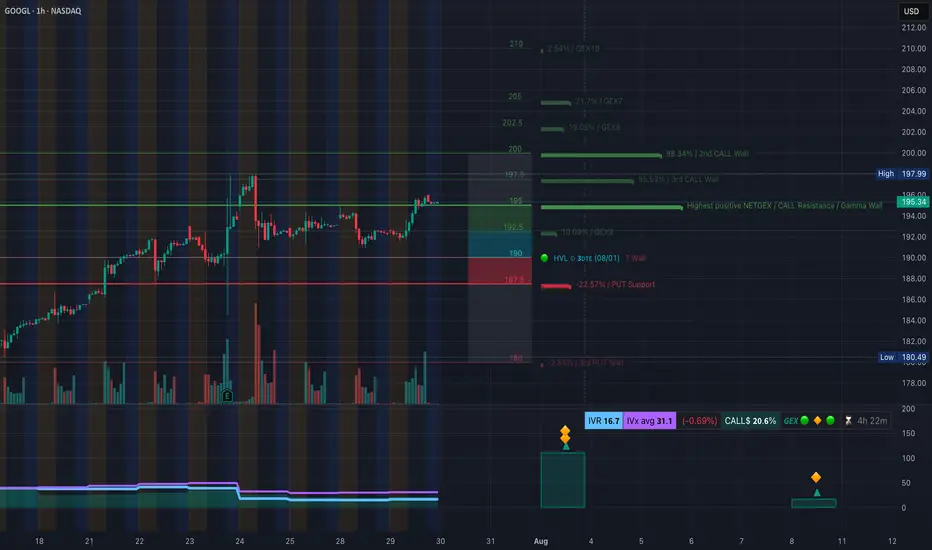
GOOGL's current price hovers around $195.30, right under a cluster of heavy Call Walls:
* 197.5 is the 3rd Call Wall (65.53%)
* 200 is the 2nd Call Wall (88.34%)
* 205-210 shows diminishing gamma influence but still has meaningful hedging overhead
Meanwhile, downside Put Support levels are more scattered:
* 190 marked as HVL and near a GEX neutral zone
* 187.5 sits on PUT Support (-22.57%)
* 180 aligns with the 3rd Put Wall
The GEX magnet appears strongest between 195–197.5, while 190 acts as a gamma floor and volatility trigger if breached. Overall GEX sentiment is neutral-to-bullish short-term, with dealers possibly pinned until a gamma release.
Options Strategy Thoughts:
* Bullish: Consider a short-term debit call spread (195C/200C), targeting a gamma squeeze above 197.5 if market flows support continuation.
* Neutral-leaning-bearish: Sell credit spreads like 200C/205C if GOOGL gets rejected at 197.5 zone and starts to compress below 194.50.
IVR is low at 16.7, while IVx is elevated near 31, suggesting buying premium could still pay off if price breaks key gamma levels fast.
Intraday Technical Analysis (1H Chart)
The 1-hour chart shows clear structure and breakout momentum:
* Break of Structure (BOS) confirmed above 194.70 on July 29
* Strong upside rally retested and held trendline support
* Price is consolidating in a tight box between 194.9–195.5, forming a potential bullish flag/channel
* Fair Value Gap (FVG) has formed near 192.5, unfilled — could serve as liquidity target if price dips
Key Support Levels:
* 194.03 (mid-level retest zone)
* 192.58–190.85 is a demand cluster and previous ChoCH zone
Key Resistance Levels:
* 197.5 is both a key psychological and GEX resistance level
* 200 is strong resistance based on Call Wall and prior swing highs
Price Action Outlook:
* As long as GOOGL holds above 194, the bullish bias remains intact.
* A breakout above 195.50 with volume opens the door toward 197.5 and potentially 200.
* A drop below 194 signals potential pullback to 192.5 or even deeper liquidity sweep toward 190.
My Thoughts for Tuesday's Setup:
* Scalpers: Watch for breakout retest at 194.90–195 zone. A strong 1H candle close above 195.50 with volume confirms scalp-long opportunity to 197.5.
* Swing traders: Risk-to-reward favors long above 194 with stops under 192. Targets: 197.5 → 200.
* Options: If GOOGL rejects 197.5 again, fading with cheap OTM puts targeting 190–192.5 could reward well, especially into August expiration.
Disclaimer: This analysis is for educational purposes only and does not constitute financial advice. Always conduct your own research and manage risk appropriately before trading.
GOGL35 trade ideas
GOOGL TRADE IDEA (07/24)
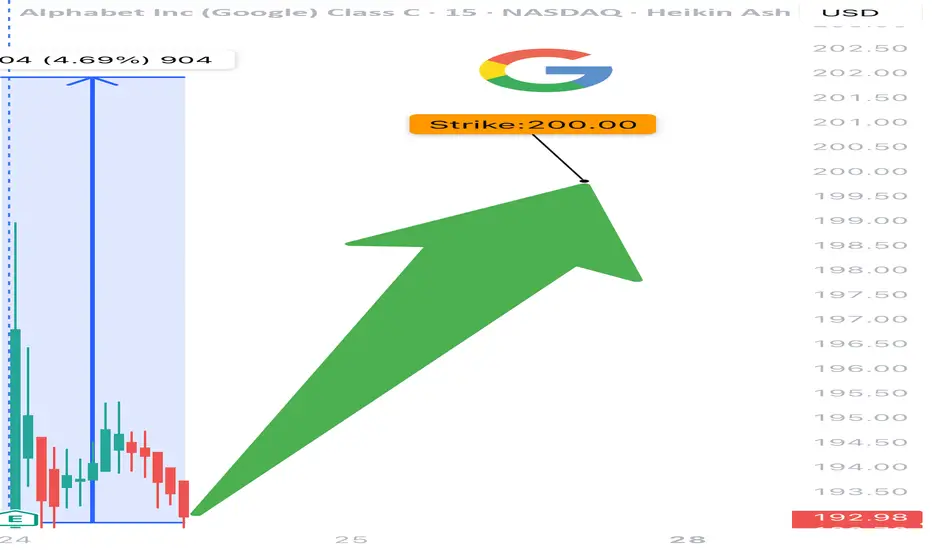
🚨 GOOGL TRADE IDEA (07/24) 🚨
💥 Big institutional flow. 1 DTE. High gamma = high reward (⚠️ high risk too)
🧠 Quick Breakdown:
• Call/Put Ratio: 2.44 → ultra bullish
• Weekly RSI climbing (67.3) 📈
• Daily RSI falling from 77.5 → 🔻 short-term pullback risk
• Reports split: trade or wait? We’re in.
💥 TRADE SETUP
🟢 Buy GOOGL $200 Call exp 7/25
💰 Entry: $2.09
🎯 Target: $3.14–$4.18 (50–100%)
🛑 Stop: $1.25
📈 Confidence: 70%
⚠️ Expiry in 1 day = tight execution needed. Gamma can cut both ways. Watch it like a hawk. 👀
#GOOGL #OptionsFlow #CallOption #GammaSqueeze #TechStocks #UnusualOptionsActivity #TradingView #StockAlerts #BigMoneyMoves #DayTrading #OptionsTrading
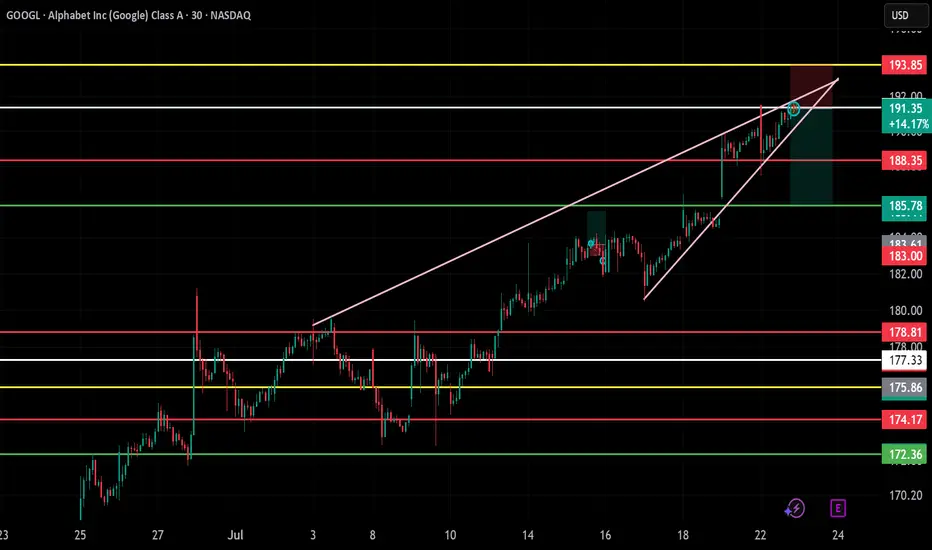
GOOGL – Short Trade!📌
Entry: 191.35
Target: 185.78
Stop-Loss: 193.85
Setup: Rising Wedge Breakdown
Bias: Bearish
GOOGL Ready to Recharge or Break? TA for July 16📊 GEX Sentiment & Options Outlook (Based on July 15 Data)
* Key Resistance Zone:
‣ 184–185: Highest Positive NET GEX, 3rd Call Wall → Strong gamma resistance
‣ 190–192.5: Additional call wall cluster—unlikely to break without strong momentum
‣ 195: GEX10 level (top bullish magnet if a breakout triggers)
* Support Zone:
‣ 180: Minor call wall, near current price
‣ 177.5: HVL zone for July 18 expiration — gamma cushion
‣ 172.5 / 167.5: Key PUT walls — heavy gamma support
* GEX Bias:
→ Neutral-to-Bullish skew with 43.11% Call Wall support near 180, and strong upward pressure up to 185 if price stays above 180.
* Options Sentiment:
* IVR: 38.8 (moderate)
* Calls Dominance: 27% of total options flow
* Bias: Bullish if price remains above 180 base; bearish break under 177.5 may open path to PUT zones.
📈 1-Hour Chart Smart Money Price Action (SMC-Based Analysis)
* Market Structure:
* Strong BOS (Break of Structure) confirms trend
* Minor CHoCH pullback near 180–182 zone showing healthy consolidation
* Holding mid-channel support trendline
* Key Zones:
* Purple Supply Zone at 182.5–183.5 — expect reactions
* Demand Zone near 174.5–172.5 — major support and rebuy area
* Trendline Support: Still intact, price respecting channel so far
* Trade Scenarios:
🔹 Bullish Setup:
* Entry: Break and hold above 183
* Target: 185 → 187.5
* Stop: Below 180
* 🔻 Bearish Setup:
* Entry: Loss of 180 and breakdown under 177.5
* Target: 174.5 → 172
* Stop: Above 182.5
* Bias: Consolidating, leaning bullish if it defends trendline and clears purple supply. Look for a reclaim of 183 with volume for next leg.
🎯 Final Thoughts
If GOOGL holds above 180, there's potential for a gamma squeeze into 185–187.5. However, a break below 177.5 flips sentiment short, targeting the demand zone around 174–172. Wait for structure confirmation before chasing.
This analysis is for educational purposes only and does not constitute financial advice. Always do your own research and manage your risk before trading.

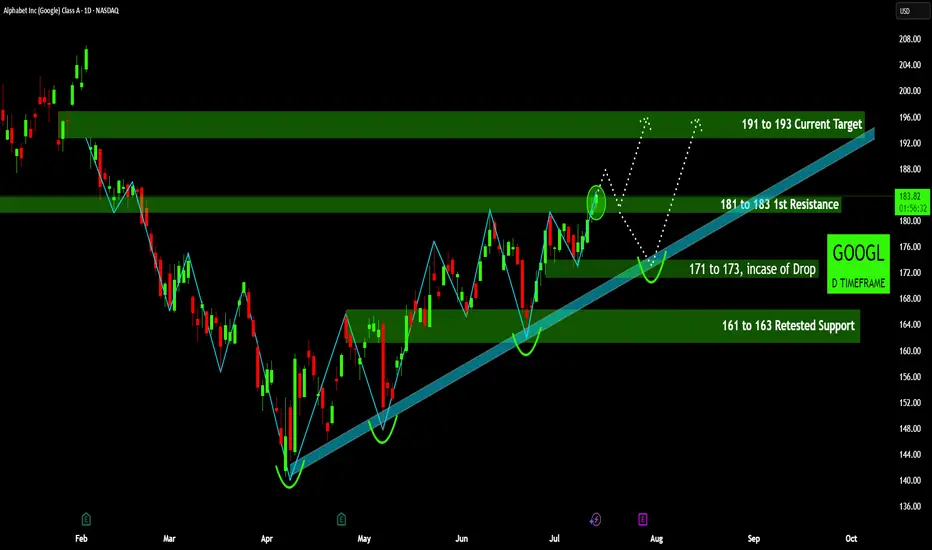
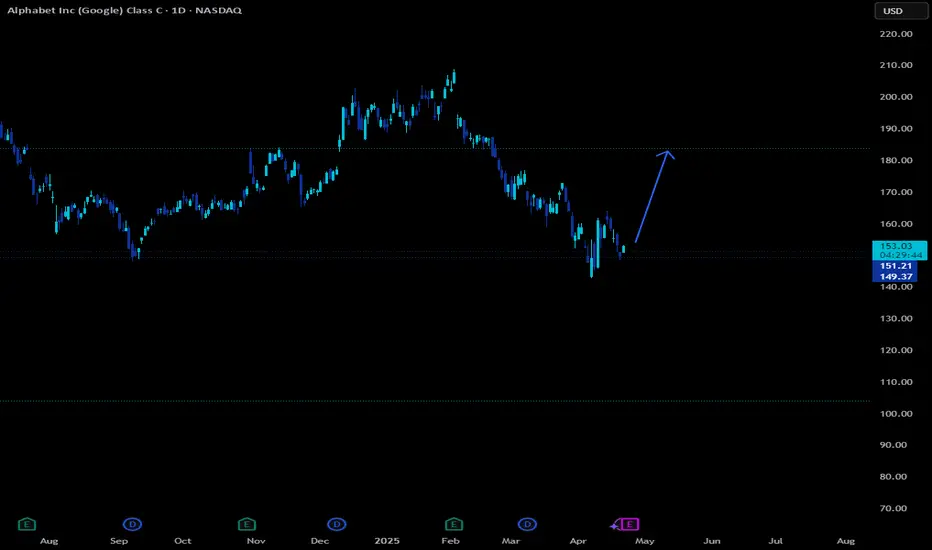
Analyzing GOOGL's Path: Breakouts and Critical Support• Strong Upward Trendline : The chart clearly displays an ascending trendline (light blue) from early April, indicating a robust bullish trend. The price has consistently found support at or near this line, reinforcing its significance as a key technical level.
• Recent Breakout and Potential Retest : The price has recently broken above a notable resistance zone around the $181-$183 mark (highlighted in green). The dotted white lines suggest a potential retest of this newly formed support level before a continuation of the upward movement, a common pattern following a breakout.
• Identified Price Targets Ahead : Two distinct target zones are identified above the current price: the $181 to $183 range as the "1st Target" (already reached/broken out of), and a higher "2nd Target" between $191 to $193. These represent areas where upward momentum might face resistance or profit-taking.
• Critical Support Zone for Drop Scenarios : In the event of a price drop, the chart indicates a critical support zone from $171 to $173. This area aligns with the ascending trendline, making it a crucial level to watch for potential bounces if the price pulls back.
• Confirmed Retested Support Below : Further down, the chart highlights a retested support zone between $161 and $163. The repeated testing and holding of this level affirm its strength as a reliable base for the price in the longer term.
Disclaimer:
The information provided in this chart is for educational and informational purposes only and should not be considered as investment advice. Trading and investing involve substantial risk and are not suitable for every investor. You should carefully consider your financial situation and consult with a financial advisor before making any investment decisions. The creator of this chart does not guarantee any specific outcome or profit and is not responsible for any losses incurred as a result of using this information. Past performance is not indicative of future results. Use this information at your own risk. This chart has been created for my own improvement in Trading and Investment Analysis. Please do your own analysis before any investments.
GOOGL Eyeing a Gamma Launch Above $182. for July 14🔹 GEX Options Sentiment Analysis
* Gamma Resistance Zone:
The $180 level marks the highest positive Net GEX / Call Wall, making it a magnet and potential resistance for GOOGL.
Above that:
* $182.5 = 2nd Call Wall
* $185 = 3rd Call Wall
* $186.43 is the extreme call zone from GEX
* Put Walls (Support):
* $172.5 = 2nd Put Wall
* $167.5 = HVL
* $165 = 3rd Put Wall
* IVR & Call/Put Sentiment:
* IVR = 38.4 → moderate implied volatility ranking
* IVX avg = 42
* GEX Score = 🟢🟢🟢 (bullish bias)
* CALLs flow = 26.5% net positive
🔸 Implication:
With price above $180 gamma wall and still pushing into $182.5–$185 range, GOOGL is positioned for a potential gamma squeeze, especially if volume supports a move over $182.5.
💡 Options Trade Suggestion Based on GEX
Bullish Scenario:
* 📈 GOOGL 182.5C 07/19 or 07/26
* Entry: On break and hold above $181.50
* Target: $185–$186.5
* Stop: Below $179.50
* Reason: Riding gamma squeeze above the GEX resistance wall with strong call flow and IV breakout potential.
Bearish Rejection Scenario (if false breakout):
* 📉 GOOGL 175P 07/26
* Entry: If price rejects $182.5 and breaks below $179
* Target: $174 → $172.5
* Stop: Above $181.20
📊 1H Chart Analysis (SMC Price Action)
* Market Structure:
* Clean Break of Structure (BOS) confirmed above previous highs.
* Price is currently consolidating inside a bearish OB between $180–$181.40.
* Key Levels:
* Support: $178.8 / $177.6
* Demand Zone: $174.65 → $172.79
* Resistance: $182.5 → $185 zone
* Bias: Bullish (as long as price holds above $177.6)
* Trendline: Still being respected, with CHoCH flip bullish.
📍 Trade Setup Based on 1H Chart
Scalping Intraday Long Setup:
* Long above $181.40 (breakout from OB)
* Target: $182.5 → $185
* Stop: Below $179.80
Intraday Short Setup (if rejected):
* Short below $179
* Target: $177.6 → $174.6
* Stop: Above $181.25
🧠 Final Thoughts
GOOGL looks ripe for continuation as long as price remains above the $180 GEX wall. However, failure to clear $182.5 could invite profit-taking. Watch volume into open and how it behaves near the order block range.
Disclaimer: This analysis is for educational purposes only and not financial advice. Trade your plan, manage your risk, and stay adaptive to market conditions.


GOOGL Raid Plan: Bulls Set to Hijack the Chart!💎🚨**Operation GOOGL Grab: Robbery in Progress! Swing & Run!**🚨💎
🌟Hi! Hola! Ola! Bonjour! Hallo! Marhaba!🌟
Dear Money Makers & Silent Robbers, 🤑💰💸✈️
Get ready for another high-stakes market heist – this time, we’re raiding the vaults of GOOGL (Alphabet Inc.) using the Thief Trading Strategy™. Based on sharp technical intel and subtle fundamental whispers, the setup is clear: the bulls have cracked the code, and it’s time to grab our loot.
🟢 🎯 ENTRY POINT - THE LOOT ZONE
"The vault is wide open!"
Snatch your bullish entry anywhere on the chart, but the pros will place limit buys on recent pullbacks (15m/30m zones), either on swing lows or highs. The pullback is your door in — don’t miss it!
🛑 STOP LOSS - ESCAPE ROUTE
Set the Thief SL at the recent 2H swing low (162.00).
But remember, each robber’s risk appetite is unique — adjust your SL based on your size, cash, and courage.
🎯 TARGET - GETAWAY MONEY
💼 Main Target: 186.50
Or if heat rises early, vanish with your gains before the full score hits. Disappear like a ghost — profit first, questions later!
🧲 FOR SCALPERS – THE QUICK GRAB
Only ride the long wave — shorting is off-limits in this mission.
If your wallet is loaded, dive in. If not, join the swing crew.
Use trailing SL to protect your cash stack 💰.
📈 THE SETUP – WHY THIS RAID WORKS
The GOOGL Market is bursting with bullish energy — a classic Red Zone robbery moment.
Overbought tension, fakeouts, trend shifts — exactly where we love to strike! Consolidation and reversals = opportunity for the brave.
📣 TRADING ALERT - NEWS AHEAD!
🚨 Avoid entries during news releases – they trigger alarms!
Use trailing SL to lock in your stash, especially during high-volatility windows.
🔍 TIPS FROM THE THIEF’S DESK
Stay updated with the latest whispers — from fundamentals to geopolitical noise, COT positioning to sentiment swings. The market changes faster than a thief on the run — so adapt fast!
💖 Show some love: 💥Hit that Boost Button💥
Let’s fuel this robbery plan with more power and precision.
Every day in the market is a new heist — let’s win like thieves, not sheep. 🏆💪🤝❤️🚀
I'll be back soon with another masterplan...
📡 Stay sharp, stay hidden — and always aim for the vault. 🤑🐱👤🎯

$GOOGL $GOOG AI Signals a Volatile Expansion 🔍 Technical Overview (Daily TF)
GOOGL is currently trading at $180.19, breaking upward inside a well-defined bullish channel, hugging equilibrium levels after consolidating just below the $184 resistance zone. This setup reflects classic Smart Money reaccumulation behavior:
🟩 Current Structure: CHoCH → BOS confirmed on higher lows
📊 Equilibrium: Mid-channel value alignment; strong price efficiency with low imbalance
🟧 Premium Zone: $202.81–208 marked for liquidity sweep (target zone)
🔴 Strong Highs: Not yet swept; draw on liquidity to the upside likely
Key price levels:
Resistance zone: $184.00–208.00
Support cluster: $172.00–168.00
Discount Block (Demand): $144.00–132.00
🤖 VolanX AI Models Forecast (as of July 12)
📌 Model 1 – Smart Money AI Trading Suite
LSTM Forecast: +9.0% gain expected over next 14 days
Target: $196.34
Market Condition: Overbought (No order blocks currently)
Volatility: 26.4%
Volume Shift: -15.5% (suggesting short-term supply exhaustion)
📌 Model 2 – WaverVanir DSS Platform
Sentiment Score: 78 (bullish bias)
15-Day Prediction: $182.34 (+1.2%)
30-Day Prediction: $184.36 (+2.3%)
📈 Note: The DSS is projecting slower upside in comparison to the Smart Money AI suite. This divergence suggests that while short-term price may rise, the major move could depend on external catalysts.
🌍 Macro & Catalyst Outlook
NASDAQ Tech Momentum: Q2 earnings in July will be a key macro driver
Yields & Dollar Index: Softening DXY supports tech; watch 10Y real yield inversion
AI Sector Beta: GOOGL is lagging NVDA/MSFT but may play catch-up into August
CPI/Inflation Watch: If inflation readings cool, it may trigger flows into mega-cap tech
Fed Policy Risk: September dot-plot shift could trigger volatility (Fed pivot vs sticky inflation)
🧠 WaverVanir DSS Conclusion:
📌 Bias: Bullish-to-Neutral
📌 Trade Zone: Watching for breakout above $184 to trigger sweep toward $196–202
📌 Invalidation: Break below $168 invalidates bullish structure; targets $144 liquidity pool
📌 Strategy: Standby mode; entry requires confirmation of volume breakout above range high.
📢 WaverVanir Insight:
"Smart Money has shown its hand — compression is a prelude to expansion. We're monitoring confluence between AI signal alignment and SMC structures. $196 target remains valid unless CHoCH flips bearish with volume."
#WaverVanir #VolanX #SmartMoneyConcepts #GOOGL #AITrading #InstitutionalFlow #LSTM #VolumeProfile #TradingView #MacroAnalysis #StockForecast #Alphabet #MarketForecast

GOOG Wave B
Bullish price action from the last couple of months has been unconvincing, and this looks more like a wave B correction.
A break of the black ascending channel would be a trigger for wave C.
It would be interesting to see a reversal pattern in smaller timeframes if price touches the gray supply zone.

GOOGL Short Term Trading IdeaEntered at $173.55 on 07/08.
Expecting earnings to be reported on 07/23 and beat expectations by a huge margin.

GOOGL Looks Ready to Reclaim the Channel for July 10GOOGL Looks Ready to Reclaim the Channel – Watch These Key Zones! 📈
🧠 GEX-Based Options Sentiment Insight (20 DTE):
GOOGL shows a strong bullish options bias going into this week, with CALLs comprising 20.3% of flow and a positive Gamma Exposure (GEX) reading. Here's the breakdown:
* Gamma Wall (Resistance): $180–$182.50
* 2nd CALL Wall: $177.50 (69.5%) – key magnet
* Highest Positive NET GEX: $180 – breakout level for upside continuation
* Support Zone: $172.5 (Put Wall -31%)
* PUT Pressure Floor: $170–$167 range (3rd/4th PUT wall cluster)
🔧 Option Strategy Suggestion:
🎯 Bullish setup
* Consider 177.5c or 180c contracts (0DTE or 7/12 expiry) for quick moves if price holds above $175 and breaks $177.50.
* Scalp the range to $179–$180, trail stops near $174.80.
* Aggressive breakout players can aim for $182.50 if volume confirms.
🛑 Bearish hedge
* If price breaks $172.50 with strong volume, consider 170p or 167.5p targeting the lower PUT Wall zone.
* Keep stops tight above $174.96.
📊 1-Hour Chart – Price Action Breakdown
GOOGL recently flipped bullish with a BOS and a solid CHoCH confirmation. Price reclaimed a critical trendline and retested a fair value gap inside the green demand zone.
* Current Price: $176.45
* Key Demand Zone: $172.8–$174.9 (multiple FVG and liquidity sweep confluence)
* CHoCH + BOS combo: Indicates momentum shift
* Supply Zone (Resistance): $177.9–$179.7
* Trendline Breakout Retest Confirmed
🧭 If buyers defend above $174.9–$175, we could see a move toward $179.67 and possibly challenge the $181.96 high. A failure below $173.5 risks a full reversion to the prior range near $170.
🎯 Trading Plan Summary:
* Bullish Scenario:
* Entry: Above $177.50
* Target: $179.67 → $182
* Stop Loss: Below $174.96
* Bearish Scenario:
* Entry: Below $172.50
* Target: $170 → $167.5
* Stop Loss: Above $175.10
This analysis is for educational purposes only and does not constitute financial advice. Always do your own research and manage risk accordingly.

Google: Upcoming TopWe locate Google in turquoise wave 2 (of a downward impulse). In more detail, we see the stock developing a complex - - - pattern and expect turquoise wave 2 to conclude imminently with wave . All the while, the price should maintain a safe distance from resistance at $209.28. Looking ahead to turquoise wave 3, we anticipate sell-offs down into our magenta Target Zone between $123.92 and $98, before wave 4 likely triggers a temporary rebound up to the $138.35 level. Ultimately, the entire turquoise downward impulse should bottom out again in the magenta zone, which would also mark the completion of waves (C) in magenta and in green. Since a new larger upward phase should begin afterward, the magenta zone presents an opportunity to establish long positions. However, if Google were to break above the $209.28 resistance next, we would have to expect a new high for magenta wave alt.(B) —which would only temporarily postpone the anticipated sell-off though (probability: 24%).
📈 Over 190 precise analyses, clear entry points, and defined Target Zones - that's what we do.

Short term (GOOG) shortCaught it on the fib pull back. Very short term trade as overall market trend is bullish.

GOOGL Dips: Buy Opportunity Looms at $173.5FenzoFx—#GOOGL broke below the previous day's low at $175.68, aiming toward the $173.53 support.
This zone is backed by the anchored VWAP, which can provide a discount price to join the bull market.

GOOGL – Sitting on the Edge! What’s Next After This Break? 📊 GEX Analysis – Options Sentiment Insight:
* Call Resistance Wall: Strongest resistance at 180–182.5 area (High GEX%, Gamma Wall, 2nd & 3rd CALL Wall). A breakout above this may trigger a gamma squeeze.
* Support Zone: HVL @ 174.39 — aligned with PUT support and GEX10 (-6.92%) at 167.5, forming a key downside guardrail.
* Gamma Exposure (GEX): Green double-dot 🟢🟢 = supportive for bullish bias but nearing exhaustion.
* IVR/IVx: IVR 40, IVx avg 37.2 — Neutral to slightly bullish. Options aren't overly expensive, risk-reward still good for directional plays.
* Call Participation: 16.4% CALLS = Moderate bullish activity but not extreme greed.
🔥 Options Strategy Idea:
* Bullish case: If price holds above 174–175, consider 7/12 or 7/19 180C debit spread (e.g., Buy 175C / Sell 180C).
* Bearish case: Break below 173.5 and you can play PUT debit spread down to 170 or 167.5.
📉 1-Hour Chart Analysis (Intraday/Swing):
* Structure: Bearish CHoCH confirmed. Price has pulled back after rejecting from red OB zone (~179.5–180).
* Current Action: Price hovering below trendline and sitting above demand zone (173.5–174.4). Break and close below this could lead to continuation down toward 170.5 / 167.5.
* Bias:
* Bearish under 177.06.
* Neutral chop zone between 174–176.6.
* Bullish recovery only above 177.5–179.5 reclaim.
🎯 Scenarios & Trade Setups:
* Scalp BUY Setup:
* Entry: Hold above 175
* Target: 177 / 179.5
* Stop: Below 173.5
* Scalp SELL Setup:
* Entry: Break and retest below 173.5
* Target: 171 → 167.5
* Stop: Back above 175
📌 Thoughts & Suggestions:
* GOOGL’s options positioning suggests a potential bounce, but the bearish CHoCH and rejection at resistance urges caution.
* If bulls reclaim 177.5, we may see a push to test the heavy CALL walls at 180–182.5.
* Trade defensively inside chop zone, don’t force full directional plays unless you see clean BOS or demand failure.
Disclaimer: This analysis is for educational purposes only and does not constitute financial advice. Always do your own research and trade responsibly.

Google Long Swing Tradewant to see us hold this yearly level to test the monthly shoulder. Would get out if we start breaking down here.
GOOGLE Count changed, Bullish outlook.I have adjusted NASDAQ:GOOG NASDAQ:GOOGL Elliot wave count with a wave 1 completing a leading diagonal backed up by a deep wave 2 correction into High Volume Node support (HVN). We potentially have another 1-2 with fast drop and recovery to the S1 daily pivot which would make long term outlook extra bullish by extending target.
Wave 3 is underway with a target of the all time hime high HVN for wave 5. The next resistance HVN is $191.
Price above the daily pivot and is continuing upwards after testing as support.
Analysis is invalidated below $162 swing low.
Safe trading

GOOGLE GOLDEN CROSS INCOMINGNASDAQ:GOOGL NASDAQ:GOOG GOLDEN CROSS!
The overhead gap will be filled.
It is inevitable.
-READ THE CHARTS 7/5/25

GOOGL Breaking Out of Downtrend? July 7🔍 GEX-Based Options Insight (Chart 1)
* Current Price: $179.53
* Highest Positive Gamma Level: $180 — this is the key gamma wall. Price is magnetized toward it and may experience hesitation or consolidation here.
* Call Walls Above:
* $182.5 → 2nd Call Wall
* $185 → 3rd Call Wall (possible extended target if momentum remains bullish)
* Put Walls Below:
* $170, $165 → Both levels suggest downside is well-defended by PUT buyers
* Options Sentiment:
* IVR: 36.2 (fairly elevated)
* IVX > IVR (IV expansion potential)
* Call Bias: 22.9% Call$, GEX bullish (green circles)
* 🔋 Interpretation: Bullish GEX + elevated IV suggests strong upward pressure. Consider buying CALL options near $179–$180, targeting a breakout continuation toward $182.5–$185.
🧠 1-Hour Technical Analysis (Chart 2)
* Structure: GOOGL just broke a local CHoCH → BOS, reclaiming short-term EMA support.
* Trendline Breakout: Clean break above descending trendline + break of BOS = bullish confirmation.
* Support Zones:
* $178.85 (minor support)
* $175.70 and $173.50 (stronger demand)
* Next Resistance Levels:
* $181.61 → matches GEX wall
* $185.0 → next key area to watch if breakout sustains
* Volume: Bullish breakout accompanied by rising volume = healthy momentum
* Bias: Leaning bullish, but needs to hold $178.85 zone to stay valid.
✅ Trade Plan Suggestion
Call Entry Idea:
* 📍 Entry: $179–$180 (on pullback or breakout)
* 🎯 Target: $182.5 → $185
* ⛔️ Stop-loss: Below $178.50
* 📆 Contract: 1–2 weeks out (due to IV and potential expansion)
Note: If it fails to hold $178.50–$175.70 zone, re-evaluate for PUTs or wait for new structure confirmation.
This analysis is for educational purposes only and does not constitute financial advice. Always manage risk and trade with a plan.

This Looks So Bullish (I See A Cup And Handle. What do you see?)Pattern Identified: Cup and Handle
From the chart of Alphabet Inc. (GOOGL), the most prominent and likely bullish pattern is a Cup and Handle formation:
Cup Formation:
The price declines sharply around February–April 2025.
It then forms a rounded bottom.
Recovers back to the previous resistance near $180 in June–July.
Handle Formation:
A short pullback (forming a small downward-sloping consolidation).
Followed by a breakout around $180.55 (current price).
Price Target Calculation:
Formula:
Target Price = Breakout Level+(Cup Height)
Breakout Level: ~$180
Cup Bottom: ~$145
Cup Height: 180 - 145 = $35
Target Price = 180+35 = 215

GOOG - Momentum - Long setupGOOG - Here is another momentum trade setup. Money flow is positive. And we have Analyst rating for this is Strong Buy.

GOOG LongMarket Structure Breakdown
Initial Break of Structure (BOS) – Bearish Phase
A significant bearish BOS occurred after a liquidity sweep above the prior high. This marked the temporary dominance of sellers, driving price downward.
Change of Character (ChoCh) – Sentiment Shift
Following the bearish leg, price printed a sharp recovery and broke above internal lower highs, signaling a Change of Character. This is the first indication of buyers regaining control.
Bullish BOS – Confirmation of Uptrend
The bullish BOS validated the upward structural transition, establishing new higher highs and higher lows. This confirms that institutional order flow has shifted bullishly.
🔹 Liquidity Dynamics
The liquidity sweep at the recent low (marked with a red dot) is a critical manipulation event, removing weak longs before institutions accumulate.
The current price action is printing a re-accumulation range, where price is likely to dip into key zones to trap breakout sellers.
Multiple liquidity pockets (green shaded regions) below serve as potential inducement zones. These areas may be revisited to gather liquidity before the next leg higher.
Final target is projected near the higher time frame sell zone around the $186–188 level, where substantial resting liquidity likely exists from previous swing highs.
🔹 Risk Management Considerations
Entry Zones: Look for confirmation-based entries within the liquidity trap zones, avoiding premature positioning at highs.
Stop-Loss: Place invalidation levels below engineered sweep zones to prevent getting caught in liquidity grabs.
Scaling Strategy: A tiered entry model can be effective here — initiating partial entries at the first trap and scaling in on deeper retracements.
Targeting: Conservative traders can aim for the internal high; aggressive positioning could seek full mitigation of the higher time frame zone.
