GOOG Post earning Analysis|25th July 23I am pretty confident about price hitting $136 and then $138. Make sure to understand price action in depth.
GOGL35 trade ideas

GOOGLE 4th wave triangle wave5 up after hours 131The chart is that of google on the hourly . It seems that we had a abcde 4th wave triangle that ended today and in after hours we are rallying in what looks to be a 5 wave . I sold my net long just alittle to early but still gained 1.6 % best of trades wavetimer

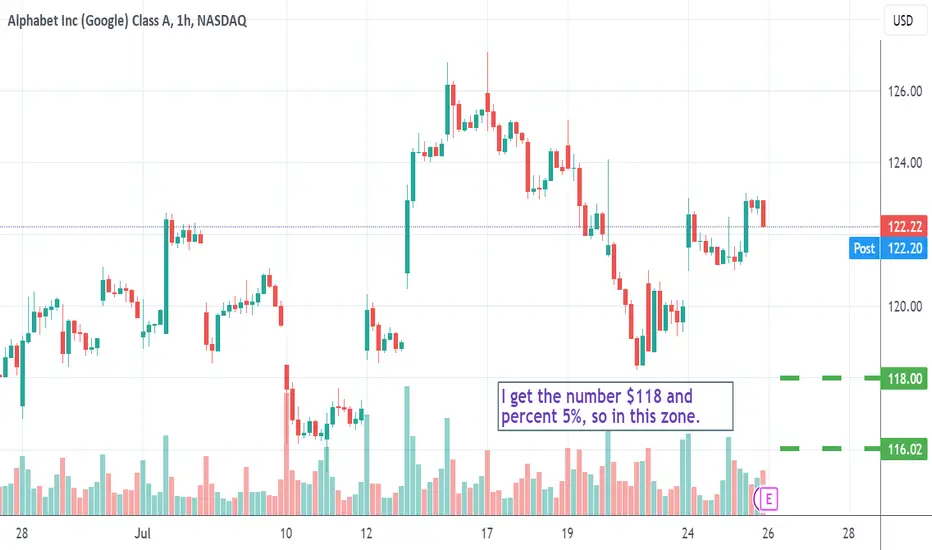
Modest down on GOOGL earningsDowsing says to look at the price $118 and also a 5% move down, which atm = $116.27
My spidey sense felt better about the downside and numbers I got were 6 and 9. 6% maybe? The 9, well, maybe my mind playing tricks lol!
We'll see!
$GOOGL EARNINGS Analysis, Key Levels & Targets NASDAQ:GOOGL EARNINGS Analysis, Key Levels & Targets
Implied move for earnings today is between 115-128 (5.24%% move)
Fun fact: Typically 8 out of 10 Gaps fill
No position here as all of my open positions right now are in SPX and SPY, but that doesn’t mean I won’t take one after earnings…. Maybe sell some puts after a selloff… 🤭 Definitely looking down from here...
$GOOGl Technical AnalysisNASDAQ:GOOGL has several bullish patterns forming. There is a Bull Flag consolidating, there is inverse head & shoulders pattern, and NASDAQ:GOOGL is above the 150 day moving average showing an uptrend.
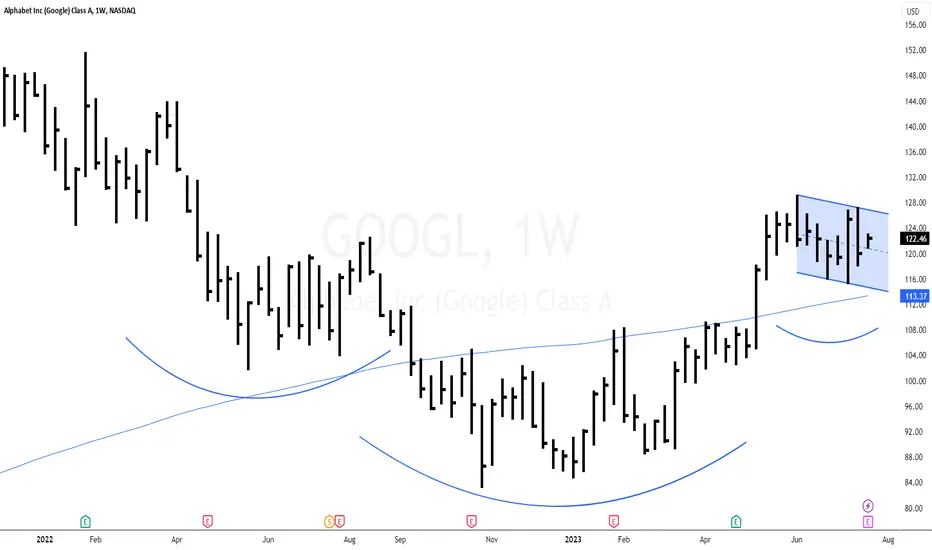
GOOGLE How is it looking before the earnings?It has been very long since we last looked into Google (GOOG) but last time we did (November 07 2022) we gave a massive buy signal (see chart below) at the market's absolute bottom:
The stock price rose +49% since then, giving us one of the most successful low risk trades of the year. With the company reporting its Earnings today though, we shift back to the 1D time-frame where the stock has been trading within a clear Channel Up throughout this recovery phase. Based on the 1D MACD Bearish into Bullish Cross sequence, we may be at a Higher Low leg as on March 13.
As long as the price is trading within the Channel Up and the (dotted) Channel Down, we remain bullish, aiming at a +21% rise (standard inside the Channel Up) and a price target of $140.00. If the price breaks below the Channels' bottoms, we will sell, targeting the 1D MA200 (orange trend-line) at $106.50.
-------------------------------------------------------------------------------
** Please LIKE 👍, FOLLOW ✅, SHARE 🙌 and COMMENT ✍ if you enjoy this idea! Also share your ideas and charts in the comments section below! **
-------------------------------------------------------------------------------
💸💸💸💸💸💸
👇 👇 👇 👇 👇 👇

Bearish sentiment for $GOOGThis is from the 3-8 strategy. Price action movement forms the 3/8 crossover for bearish movement. Price target is around $109 in short term. Not a financial advice.

Googl may rise to 125.00 - 126.25Our pivot point is at 120.
The upside prevails as long as 120 is support.
Alternative scenario
Below 120, expect 118 and 117.
Comment
The RSI is above its neutrality area at 50. The MACD is above its signal line and positive. The configuration is positive. Alphabet is trading above both its 20 and 50 period moving average (respectively at 121.02 and 120.91).
Supports and resistances
127.25 **
126.25 *
125 **
124
121.425 last
120.75
120 **
118 *
117 **

Alphabet Inc (‘GOOGL’), DailyShares in Alphabet Inc (symbol ‘GOOGL’) have made some significant gains in the second quarter of the year of around 38% and have somewhat continued their bullish run in the first half of July. The company is expected to report earnings for the quarter ending June 2023, on Tuesday 25th of July after market close. The consensus EPS is $1,32 compared to $1,21 in the same quarter last year.
Antreas Themistokleous at Exness: “ The company is very well positioned financially with the total assets outweighing total liabilities at a ratio of more than 3 : 1. This in combination with the very strong current ratio of 235% shows that the company seems to be more than able to withstand any short term economic turmoil. Investors and traders might find the current status of the company more than appealing, making it a good addition to their portfolios.”
On the technical analysis side the 50 day simple moving average is trading well above the slower 100 day simple moving average validating the overall bullish momentum in the market for the share of the tech giant. The Stochastic oscillator is recording overbought levels indicating that a correction to the downside might be a possible scenario in the near short term.
If this is confirmed then the first point of strong technical support could be laying around the $120 price area which consists of the area between the 23.6% and 38.2% of the daily Fibonacci retracement levels, the level where the 20 and 50 moving averages meet as well as the psychological support of the round number.

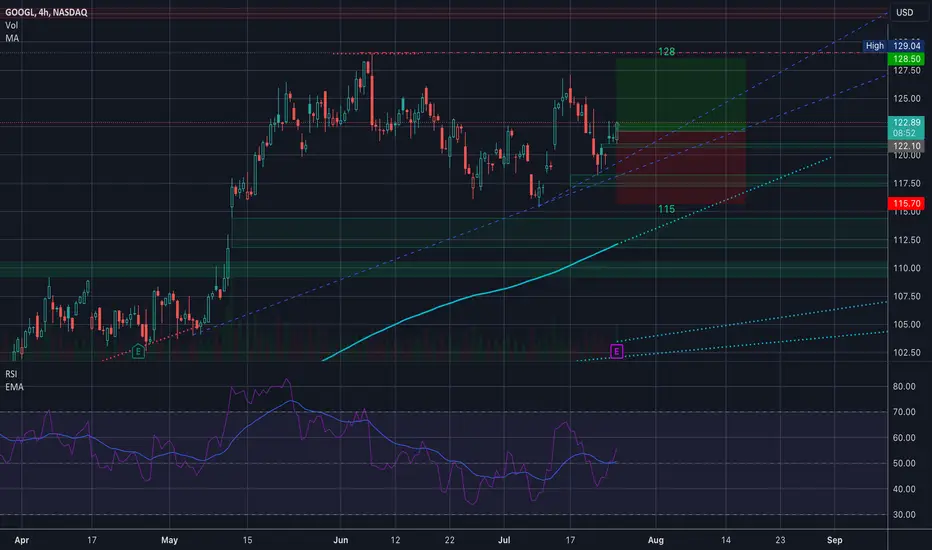
GOOG looking prime heading into earningsGOOG trading back inside this channel. It has been respecting the 4H 50MA really well so I expect it to continue with a bounce around this $122-123 range. I see it rallying up to $125 before its earnings report on Tuesday 7/25 AH.

(GOOGL) - 30min, Harmonic Pattern + Median Line Bullish SetupBullish complex harmonic pattern + median line test/re-test long entry.
Target = center line or T1 & T2
Aggressive stop-loss used to obtain a better than 4:1 risk vs. reward
DYODD

Alphabet(Google) Long BullishTechnical Bullish
HHHL above 99
Trendomat BuySell pressure Bullish
Weekly average price above Monthly average price
145.32 is critical as Volume value is weak.
Incase volume would increase and abreak above 151
Alphabet will potentially walk to above 210
A break below 86 is bearish.
Return vs Industry: GOOGL underperformed the US Interactive Media and Services industry which returned 22.5% over the past year.
Return vs Market: GOOGL underperformed the US Market which returned 14.5% over the past year.
Stable Share Price: GOOGL is less volatile than 75% of US stocks over the past 3 months, typically moving +/- 4% a week.
Volatility Over Time: GOOGL's weekly volatility (4%) has been stable over the past year.
Price-To-Earnings vs Peers: GOOGL is good value based on its Price-To-Earnings Ratio (26.7x) compared to the peer average (51x).
Price-To-Earnings vs Industry: GOOGL is expensive based on its Price-To-Earnings Ratio (26.7x) compared to the US Interactive Media and Services industry average (19.9x)
What is the Fair Price of GOOGL when looking at its future cash flows? For this estimate we use a Discounted Cash Flow model.
Below Fair Value: GOOGL ($123.1) is trading below our estimate of fair value ($160.36)
Significantly Below Fair Value: GOOGL is trading below fair value by more than 20%.
Alphabet is forecasted to grow earnings and revenue by 13.1% and 9% per annum respectively. EPS is expected to grow by 14.6%. Return on equity is forecast to be 22.3% in 3 years.
Analyst Future Growth Forecasts
Earnings vs Savings Rate: GOOGL's forecast earnings growth (13.1% per year) is above the savings rate (2.1%).
Earnings vs Market: GOOGL's earnings (13.1% per year) are forecast to grow slower than the US market (15.7% per year).
High Growth Earnings: GOOGL's earnings are forecast to grow, but not significantly.
Revenue vs Market: GOOGL's revenue (9% per year) is forecast to grow faster than the US market (7.5% per year).
High Growth Revenue: GOOGL's revenue (9% per year) is forecast to grow slower than 20% per year.
Future ROE: GOOGL's Return on Equity is forecast to be high in 3 years time (22.3%)
Earnings and Revenue History
Quality Earnings: GOOGL has high quality earnings.
Growing Profit Margin: GOOGL's current net profit margins (20.6%) are lower than last year (27.6%).
Earnings Trend: GOOGL's earnings have grown significantly by 25.9% per year over the past 5 years.
Accelerating Growth: GOOGL's has had negative earnings growth over the past year, so it can't be compared to its 5-year average.
Earnings vs Industry: GOOGL had negative earnings growth (-21.4%) over the past year, making it difficult to compare to the Interactive Media and Services industry average (-16.9%).
High ROE: GOOGL's Return on Equity (22.5%) is considered high.
Financial Position Analysis
Short Term Liabilities: GOOGL's short term assets ($162.0B) exceed its short term liabilities ($68.9B).
Long Term Liabilities: GOOGL's short term assets ($162.0B) exceed its long term liabilities ($39.7B).
Debt to Equity History and Analysis
Debt Level: GOOGL has more cash than its total debt.
Reducing Debt: GOOGL's debt to equity ratio has increased from 3.3% to 4.5% over the past 5 years.
Debt Coverage: GOOGL's debt is well covered by operating cash flow (757.9%).
Interest Coverage: GOOGL earns more interest than it pays, so coverage of interest payments is not a concern.
CEO Compensation Analysis
Compensation vs Market: Sundar's total compensation ($USD225.99M) is above average for companies of similar size in the US market ($USD12.23M).
Compensation vs Earnings: Sundar's compensation has increased by more than 20% whilst company earnings have fallen more than 20% in the past year.
Insider Buying: Insufficient data to determine if insiders have bought more shares than they have sold in the past 3 months.

Alphabet Ready For a Collapse?My 06/25/23 post noted that Alphabet (GOOG) could rally above the peak at 129.55 and top somewhere in the low 130 area. GOOG rallied but has since had a sharp reversal.
MACD has a bearish lines cross and RSI has crossed below its moving average line.
A break below 115.83 could open the door for a move down to the 90 area.

GOOGL Alphabet Options Ahead of Earnings ! Sell-Off Thesis !If you haven`t sold GOOGL here:
or reentered here:
Then analyzing the options chain and chart patterns of GOOGL Alphabet Inc prior to the earnings report this week,
I would consider purchasing the 115usd strike price Puts with
an expiration date of 2024-1-19,
for a premium of approximately $6.15.
If these options prove to be profitable prior to the earnings release, I would sell at least half of them.
While Google currently holds a dominant position in the search engine market, the landscape is dynamic and subject to change. If Microsoft successfully leverages its partnership with OpenAI to enhance Bing's capabilities, coupled with strategic marketing initiatives, it could potentially chip away at Google's market share over time.
You can read my full GOOGL Sell-Off thesis here:
Looking forward to read your opinion about it.

GOOGL DailyLooking like it may break down to fill that gap, grab that liquidity pool, then turn back up.

Earnings 7-25Descending triangle that did not totally break to the upside. Top line slopes down and bottom line virtually flat.
Price is sitting on the former resistance line of the triangle which is now support.
On monthly timeframe there is a large Doji/indecision
No recommendation/Throwback as this turned back down shortly after breakout. Throwbacks can hurt performance.

GOOGL Short before longAs i am learning to swing trades a bit more, my take on NASDAQ:GOOGL is that we come back down to $116.68 range to finish the pattern out. I know Youtube just released news on subscription increases, which in my opinion is bullish overall. Never the less I am still looking for NASDAQ:GOOGL to give us a slight retracement back to that $116.68 range. Please feel free to comment and give your over view on it as i am trying to learn as much as possible

GOOG - BO over DTLRGOOG broke over descending trendline resistance yesterday with +20% volume; not super-impressive but SPY vol was -10% and XLK vol was -25% so clearly GOOG was getting good rotation. TRS now ascending with bullish alignment.
Need to get FT today. This area was good support back in Jul '21 and retested multiple times Jan-Mar '22 before caving in Apr. We got a retest somewhat in Aug and we're coming off yet another. So I want to see GOOG take out the last SH at $126.70, 52WH at $129.55 then possible resistance around $131.
Earnings Jul 25

Google seems to be falling along with other Fintech and giants as we can see google is consolidating at its ATH so there are good chances that, this ticker falls down and retraces down to its preview supports
as we know there are some fundamental news also going on about some anti-republican activity and censorship on YouTube and other domains in this company so we can have some fall speculation on this company for a while.
please comment your opinions

GOOGLE LONG IDEA TO TAKE BUYSIDE LIQUIDITY Look for google to break above the inversion sib then use it as support to push the buy side liquidity.

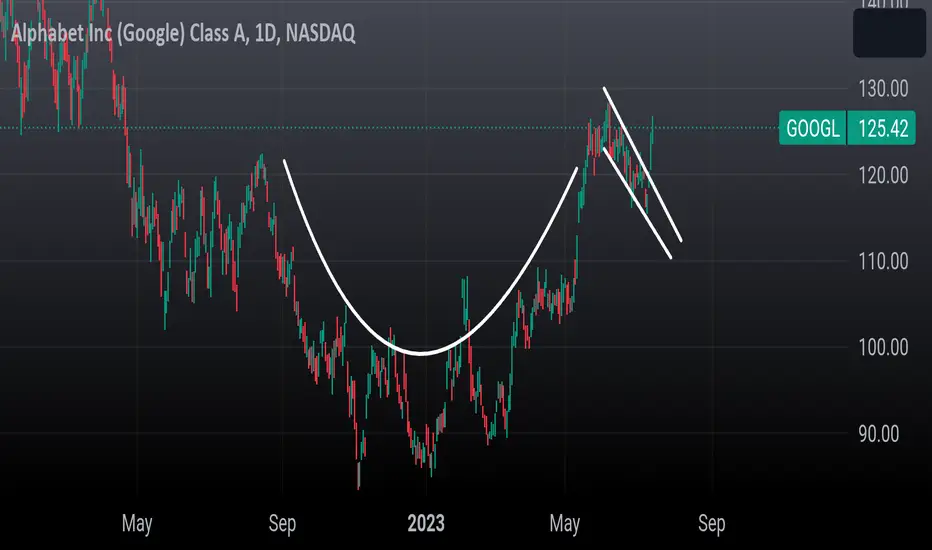
GOOG inverse cup and handleDaily timeframe inverse cup and handle. Has 2 gap fills in both directions. It will fill either one tomorrow depending on how CPI data is. Leaning more to the bullish upside due to the market sentiment that CPI data will show a cooldown from the 4% May data.

LONG GOOGLEPrice reached double bottom on 15 min chart and price came down in a bearish wedge on 1 min we will target top of the wedge.
1 Min Chart Below.

GooglWeekly right shoulder is setting up for a very large move higher.
Fib levels are from 2020 low and ATH.. As you can see 127 is very tough. I'd only go long with a close over 128.
A couple of patterns are playing out here.
The bigger picture is the Inverted H&S
The second pattern is the bullflag on the weekly. Flag took 6 weeks to form
My targets are the gaps 133 then 140. So if you're a swing trader , you would go long over 128 and take profit at 133 gap close.. le5 things cool down then go back long for 140.
Long over 128.. 126.00 stop loss