False Breakout, breakdownGS lost horiz support after false breakout from downtrend, 188 should come fast, when/if that breaks , new lows coming.
GSGI34 trade ideas

Goldman Sachs - Will follow the JPM path? - 01Goldman Sachs - Will follow the JPM path?
Comparison between GS and JPM

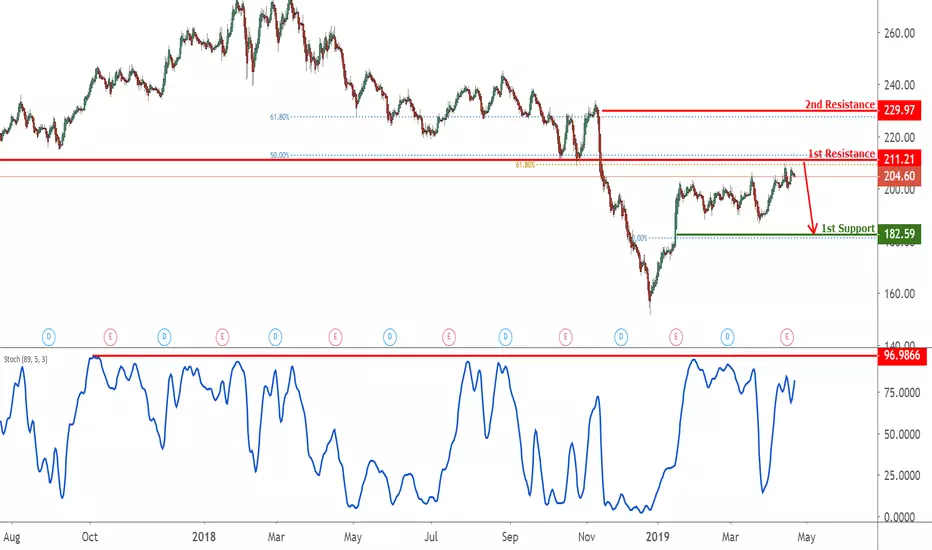
GS Approaching Resistance, Potential Reversal! GS is approaching its resistance where a reversal could occur.


$GS Goldman will reward the bulls. We are looking for a break of resistance in GS at $209 for a quick jump to $219, price action is limited in this zone given the speed in which the stock dropped. We hope for a speedy move up to the golden pocket at approx $228. If and when the wheels fall of tech , financials is where the wise money will continue to hide out. We are bullish financials.

$GS looks temping herePrice bounced nicely off of the 50 day moving average on the daily chart and is shaping up nicely here on the hourly chart.

GS Reversed Off Resistance, Potential Drop!GS reversed off its resistance where we could see a further drop to its support.

GS going for a bearish or bullish move?The stock has made a rather large bearish move, that has closed beneath the support/resistance line. It has reversed and made a smaller bullish move and is now at the previously mentioned support/resistance line. We are expecting the price to bounce of this line and make another bearish move. If we see a breakout to the bullish side, we are waiting for the confirmation of the bullish move, and the entering a long position.
On the four hour chart we can see, that the price has recently broken the support/resistance line, that could indicate a smaller bullish move if we see a confirmation of the breakout.
Feel free to pick up a copy of our Free Weekly Market Outlook here:
mailchi.mp
We wish you good luck with your trading!

Goldman Sachs (GS) Cleared a LevelTheory is that each box jump/drop requires the same amount of time, and thus GS looks poised to spend some time bouncing between 205 and 220. Idea negated if 205 zone is lost.
Target: 220

GS Reversed Off Resistance, Potential Drop!GS reversed off its resistance where we could see a further drop to its support.
Daily KEY outside-reversal on Goldman after Q1-earnings?KEY-outside reversal on Goldman after Q1-earnings?


GS - SHORT TERM BEARISH, LONG TERM BULLISHGS ER report before the Open
- rejected and closed below MA200
- falling resistance around 211.56
- MACD is the only bullish signal

Goldman Sachs in PlayLooks like it may be an exciting Monday just like Friday. Goldman and Morgan Stanley are in play this week. GS MS GS

Goldman Sachs Update - Buy Buy Buy!I've added the ichokucloud fibonacci to this chart. Looks like my previous analysis was correct, broke out from the base established over the past 2 months. Earnings Monday morning should make this pop along the new trend line.
NYSE:GS NYSE:GS


GoldmanSachs Breaks Out With Other Financials $GSGood Morning,
I held some $210 and $230 call options overnight. Looks like we're about to head up toward at least the $216 area if not higher. Earnings are reported Monday morning prior to the bell.

$GS GOLDMAN SACHS , LONG INTO EARNINGS, AND BEYOND.Goldman Sachs was a long for us into last earnings and we were rewarded, since then it has consolidated and we predict another upward move next week. Long term we believe investors will be rotating back into the financials
and out of some of the high flying tech companies weighed down with huge debt. Not everyone agrees but the banks are safer, and a new cycle of investment is starting we believe.

Goldman Sachs Earnings Pop? Hey guys, quick disclaimer; I am a novice technician but I'm here to learn!
I'm playing some $210 call options for Goldman Sachs earnings.
Goldman to me, has more upside potential in the financials vs. JPM or BAC. And with the onslaught of IPOs it should be a forgone conclusion their revenue/earnings should be boosted in that environment. The SPY appears to want to make another attempt at all time highs so I've shifted my view to GS for a catchup trade with GS.
Feel free to give me your thoughts on the trade or the chart analysis.
Thanks!
-R

$GS Goldman Gives HopeAfter a torrid year Goldman Sachs is showing signs of life. Troubles with yields and scandals seem to abating. Had a very positive move on last earnings report and the charts point to another upward move after consolidating.
Please follow our website link below to sign up to avail of our FREE E-Mail and Text Message ALERT service so you don't miss another opportunity. A few simple steps and you are part of our community.
www.topmarketgainers.com