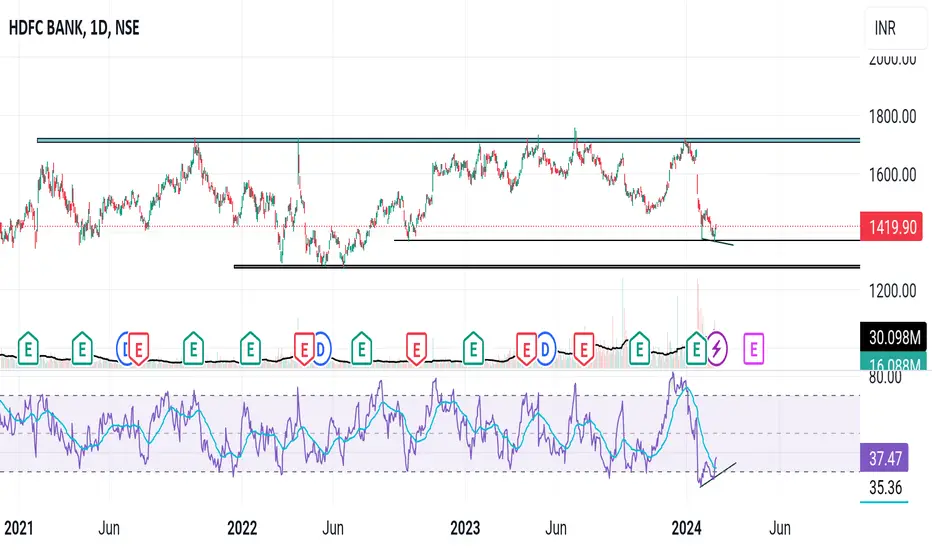
HDFC BANK S/R for 19/2/24Support and Resistance Levels:
Based on the price action, you have to identify two significant levels: the red line acting as resistance and the green line acting as support. Additionally, there have marked red and green shades to represent resistance and support zones, respectively.
Support: The green line and green shade represent support levels. These levels are where the price tends to find buying interest, preventing it from falling further. Traders can consider these levels as potential buying opportunities.
Resistance: The red line and red shade represent resistance levels. These levels are where the price tends to encounter selling pressure, preventing it from rising further. Traders can consider these levels as potential selling opportunities.
Breakouts: If the price breaks above the resistance zone (red shade) convincingly, it may indicate a bullish breakout, and the price could move higher to the next resistance level. On the other hand, if the price breaks below the support zone (green shade) convincingly, it may indicate a bearish breakout, and the price could move lower to the next support level.
Keltner Channel:
The Keltner Channel is a technical indicator that uses an exponential moving average (EMA) to create an upper and lower channel around the price action. Traders can use this channel to identify potential long and short positions.
Long Position: If the price is above the upper line of the Keltner Channel, it may indicate a potential long opportunity, as it suggests the price is trading above the average range and might continue in an upward trend.
Short Position: If the price is below the lower line of the Keltner Channel, it may indicate a potential short opportunity, as it suggests the price is trading below the average range and might continue in a downward trend.
Disclosure: I am not SEBI registered. I just wanted to let you know that the information provided here is for learning purposes only. Please consult your financial advisor before making any decisions. Tweets neither advice nor endorsement.
H1DB34 trade ideas

Time for hdfc bankBouncing from support.. bullish divergence..mutual funds accumulating in large amounts..hdfc bank is a giant.. no need of introduction.. best time for investors to enter for target 1700+.. 20%.. for traders sl is 1350 dcb
Short Swing Trade in HDFCBANKEverything is pretty much explained in the picture itself.
For any query kindly dm.
Thank you So Much.

will $NSE:HDFCBANK take support ?Dear Traders,
I hope this message finds you well. I wanted to provide you with a brief update on the stock NSE:HDFCBANK I have been monitoring.
It appears that the stock is approaching a potential Support level Near 1400-1405 This is an important technical point where the price has historically had difficulty breaking through. It suggests that we may see a temporary halt in the current upward momentum and Possibly it will test 1480-1500 In Upmove.
Resistance Levels to Watch out.
Resistance levels are the opposite, representing prices at which a stock has historically struggled to move above. These levels can signal a selling interest. Understanding resistance points is crucial for anticipating potential obstacles in the upward movement of a stock.
R1= 1460
R2= 1520
R3= 1570
Support Levels To Watchout.
Support levels represent prices at which a stock has historically had difficulty falling below. These levels often indicate a strong buying interest. It's important to monitor these levels, as a breach might suggest a potential downward trend.
S1= 1400
S2= 1340
S3= 1280
As always, please remember that investing involves risks, and it's important to carefully consider your options. If you have any questions or would like to discuss this further, please don't hesitate to reach out.
Best regards,

HDFCBANK On Verge of Breaking out - Expecting to Test 1760While rest of the large cap in India market have started to catch up with mid and small caps after the state election results, HDFCBANK caught the fever a bit late and just has started to move breaking the previous resistance. Closing at 1646 on 12/15 - right at the the .61 Fibo level with pivots as Feb '23 high and Q3 Low - support level is well established in this 1610-1646 range and likely going to hold on any unfavorable macro news. On the other, on Monday 12/18, expect move above 1670 pre-market and test around 1696 - a Fibo .78 level within few hours in the day. The RSI is near overbought level at daily, I expect some strong resistance at 1696. However due to strong macro tailwind, eventually this should break and HDFCBANK should test 1721 the previous strong resistance this week itself. If this breaks into all time high of 1760+ to be seen but I will be surprised to see that happen this week.

HDFC BANK good for long termHDFC Bank looks good for long term. if we the weekly chart, we can see its forming bullish pattern at their support zone.

HDFC BANK S/R for 15/2/24Support and Resistance Levels:
Based on the price action, you have to identify two significant levels: the red line acting as resistance and the green line acting as support. Additionally, there have marked red and green shades to represent resistance and support zones, respectively.
Support: The green line and green shade represent support levels. These levels are where the price tends to find buying interest, preventing it from falling further. Traders can consider these levels as potential buying opportunities.
Resistance: The red line and red shade represent resistance levels. These levels are where the price tends to encounter selling pressure, preventing it from rising further. Traders can consider these levels as potential selling opportunities.
Breakouts: If the price breaks above the resistance zone (red shade) convincingly, it may indicate a bullish breakout, and the price could move higher to the next resistance level. On the other hand, if the price breaks below the support zone (green shade) convincingly, it may indicate a bearish breakout, and the price could move lower to the next support level.
Keltner Channel:
The Keltner Channel is a technical indicator that uses an exponential moving average (EMA) to create an upper and lower channel around the price action. Traders can use this channel to identify potential long and short positions.
Long Position: If the price is above the upper line of the Keltner Channel, it may indicate a potential long opportunity, as it suggests the price is trading above the average range and might continue in an upward trend.
Short Position: If the price is below the lower line of the Keltner Channel, it may indicate a potential short opportunity, as it suggests the price is trading below the average range and might continue in a downward trend.
Disclosure: I am not SEBI registered. I just wanted to let you know that the information provided here is for learning purposes only. Please consult your financial advisor before making any decisions. Tweets neither advice nor endorsement.

HDFCBANK: Some more time before take offThe region between 1300 - 1750 is where the stock has moved over the last 3-4 years, significantly underperforming the overall benchmark indices, and also within the PVT banking space.
1300 - 1400 is a good range to accumulate for long term (3+ years). At first, it should break out of the range and trade above 1750, beyong which 2200-2500 opens up. The risk reward is in favour of long term investors.
If you want to exit, and move your capital to other stocks, 1300 should be the lakshman rekha (on WCB)

HDFC BANK S/R for 14/2/24Support and Resistance Levels:
Based on the price action, you have to identify two significant levels: the red line acting as resistance and the green line acting as support. Additionally, there have marked red and green shades to represent resistance and support zones, respectively.
Support: The green line and green shade represent support levels. These levels are where the price tends to find buying interest, preventing it from falling further. Traders can consider these levels as potential buying opportunities.
Resistance: The red line and red shade represent resistance levels. These levels are where the price tends to encounter selling pressure, preventing it from rising further. Traders can consider these levels as potential selling opportunities.
Breakouts: If the price breaks above the resistance zone (red shade) convincingly, it may indicate a bullish breakout, and the price could move higher to the next resistance level. On the other hand, if the price breaks below the support zone (green shade) convincingly, it may indicate a bearish breakout, and the price could move lower to the next support level.
Keltner Channel:
The Keltner Channel is a technical indicator that uses an exponential moving average (EMA) to create an upper and lower channel around the price action. Traders can use this channel to identify potential long and short positions.
Long Position: If the price is above the upper line of the Keltner Channel, it may indicate a potential long opportunity, as it suggests the price is trading above the average range and might continue in an upward trend.
Short Position: If the price is below the lower line of the Keltner Channel, it may indicate a potential short opportunity, as it suggests the price is trading below the average range and might continue in a downward trend.
Disclosure: I am not SEBI registered. I just wanted to let you know that the information provided here is for learning purposes only. Please consult your financial advisor before making any decisions. Tweets neither advice nor endorsement.

HDFC BANK S/R for 13/2/24Support and Resistance Levels:
Based on the price action, you have to identify two significant levels: the red line acting as resistance and the green line acting as support. Additionally, there have marked red and green shades to represent resistance and support zones, respectively.
Support: The green line and green shade represent support levels. These levels are where the price tends to find buying interest, preventing it from falling further. Traders can consider these levels as potential buying opportunities.
Resistance: The red line and red shade represent resistance levels. These levels are where the price tends to encounter selling pressure, preventing it from rising further. Traders can consider these levels as potential selling opportunities.
Breakouts: If the price breaks above the resistance zone (red shade) convincingly, it may indicate a bullish breakout, and the price could move higher to the next resistance level. On the other hand, if the price breaks below the support zone (green shade) convincingly, it may indicate a bearish breakout, and the price could move lower to the next support level.
Keltner Channel:
The Keltner Channel is a technical indicator that uses an exponential moving average (EMA) to create an upper and lower channel around the price action. Traders can use this channel to identify potential long and short positions.
Long Position: If the price is above the upper line of the Keltner Channel, it may indicate a potential long opportunity, as it suggests the price is trading above the average range and might continue in an upward trend.
Short Position: If the price is below the lower line of the Keltner Channel, it may indicate a potential short opportunity, as it suggests the price is trading below the average range and might continue in a downward trend.
Disclosure: I am not SEBI registered. I just wanted to let you know that the information provided here is for learning purposes only. Please consult your financial advisor before making any decisions. Tweets neither advice nor endorsement.

HDFC Bank looks interesting check out There is multiple divergence in the stock seems like the recent fall was to scare weak investor the stock seems being accumulated check the chart

HDFC BANK S/R for 12/2/24Support and Resistance Levels:
Based on the price action, you have to identify two significant levels: the red line acting as resistance and the green line acting as support. Additionally, there have marked red and green shades to represent resistance and support zones, respectively.
Support: The green line and green shade represent support levels. These levels are where the price tends to find buying interest, preventing it from falling further. Traders can consider these levels as potential buying opportunities.
Resistance: The red line and red shade represent resistance levels. These levels are where the price tends to encounter selling pressure, preventing it from rising further. Traders can consider these levels as potential selling opportunities.
Breakouts: If the price breaks above the resistance zone (red shade) convincingly, it may indicate a bullish breakout, and the price could move higher to the next resistance level. On the other hand, if the price breaks below the support zone (green shade) convincingly, it may indicate a bearish breakout, and the price could move lower to the next support level.
Keltner Channel:
The Keltner Channel is a technical indicator that uses an exponential moving average (EMA) to create an upper and lower channel around the price action. Traders can use this channel to identify potential long and short positions.
Long Position: If the price is above the upper line of the Keltner Channel, it may indicate a potential long opportunity, as it suggests the price is trading above the average range and might continue in an upward trend.
Short Position: If the price is below the lower line of the Keltner Channel, it may indicate a potential short opportunity, as it suggests the price is trading below the average range and might continue in a downward trend.
Disclosure: I am not SEBI registered. I just wanted to let you know that the information provided here is for learning purposes only. Please consult your financial advisor before making any decisions. Tweets neither advice nor endorsement.

EXPECTED IMPORTANT DIRECTIONAL LEVELS FOR THE YEAR 2024NSE:HDFCBANK NSE:BANKNIFTY
Hey Folks..!
I have marked all the important directional level for this year.
All the levels have the description, Bullish movements is expected in bullish range and Downside is expected in the bearish range.
Use the levels either Standalone or Club these levels with your existing trading style & strategy it will surely give you an edge.
Rules are simple , Short trades can work well in the Red / Bearish ranges whereas Long trades can work well in the Bullish ranges.
Also, i have changed the colour combination of the chart along with the candle colour now green candle are white and red candles are black.
All the best Folks!

HDFC S/R for 9/2/24Support and Resistance Levels:
Based on the price action, you have to identify two significant levels: the red line acting as resistance and the green line acting as support. Additionally, there have marked red and green shades to represent resistance and support zones, respectively.
Support: The green line and green shade represent support levels. These levels are where the price tends to find buying interest, preventing it from falling further. Traders can consider these levels as potential buying opportunities.
Resistance: The red line and red shade represent resistance levels. These levels are where the price tends to encounter selling pressure, preventing it from rising further. Traders can consider these levels as potential selling opportunities.
Breakouts: If the price breaks above the resistance zone (red shade) convincingly, it may indicate a bullish breakout, and the price could move higher to the next resistance level. On the other hand, if the price breaks below the support zone (green shade) convincingly, it may indicate a bearish breakout, and the price could move lower to the next support level.
Keltner Channel:
The Keltner Channel is a technical indicator that uses an exponential moving average (EMA) to create an upper and lower channel around the price action. Traders can use this channel to identify potential long and short positions.
Long Position: If the price is above the upper line of the Keltner Channel, it may indicate a potential long opportunity, as it suggests the price is trading above the average range and might continue in an upward trend.
Short Position: If the price is below the lower line of the Keltner Channel, it may indicate a potential short opportunity, as it suggests the price is trading below the average range and might continue in a downward trend.
Disclosure: I am not SEBI registered. I just wanted to let you know that the information provided here is for learning purposes only. Please consult your financial advisor before making any decisions. Tweets neither advice nor endorsement.

HDFC Bank another 10% correction possible?Looks like HDFC bank might test 1410 in the coming days, lets see if that happens

HDFC BankHDFC Bank Sure shot trade.
Buy Zone marked. Also accumulate more of it go to 1350.
Surely it will reach 1650.

HDFCBANIn this area, the stock is facing difficult resistance to the upside, with the presence of a sub-wave of three Elliott rules.. so we may have to correct the shaded area in order to take support from it and complete its upward journey.
Please clarify that I am helping you with my point of view, which may be right or wrong, and see my previous analyzes of many currencies and forex in order to judge the owner of this analysis with a more accurate look
Good luck

HDFC BANK S/R for 6/1/24Support and Resistance Levels:
Based on the price action, you have to identify two significant levels: the red line acting as resistance and the green line acting as support. Additionally, there have marked red and green shades to represent resistance and support zones, respectively.
Support: The green line and green shade represent support levels. These levels are where the price tends to find buying interest, preventing it from falling further. Traders can consider these levels as potential buying opportunities.
Resistance: The red line and red shade represent resistance levels. These levels are where the price tends to encounter selling pressure, preventing it from rising further. Traders can consider these levels as potential selling opportunities.
Breakouts: If the price breaks above the resistance zone (red shade) convincingly, it may indicate a bullish breakout, and the price could move higher to the next resistance level. On the other hand, if the price breaks below the support zone (green shade) convincingly, it may indicate a bearish breakout, and the price could move lower to the next support level.
Keltner Channel:
The Keltner Channel is a technical indicator that uses an exponential moving average (EMA) to create an upper and lower channel around the price action. Traders can use this channel to identify potential long and short positions.
Long Position: If the price is above the upper line of the Keltner Channel, it may indicate a potential long opportunity, as it suggests the price is trading above the average range and might continue in an upward trend.
Short Position: If the price is below the lower line of the Keltner Channel, it may indicate a potential short opportunity, as it suggests the price is trading below the average range and might continue in a downward trend.
Disclosure: I am not SEBI registered. I just wanted to let you know that the information provided here is for learning purposes only. Please consult your financial advisor before making any decisions. Tweets neither advice nor endorsement.


HDFC BANK S/R for 5/1/24Support and Resistance Levels:
Based on the price action, you have to identify two significant levels: the red line acting as resistance and the green line acting as support. Additionally, there have marked red and green shades to represent resistance and support zones, respectively.
Support: The green line and green shade represent support levels. These levels are where the price tends to find buying interest, preventing it from falling further. Traders can consider these levels as potential buying opportunities.
Resistance: The red line and red shade represent resistance levels. These levels are where the price tends to encounter selling pressure, preventing it from rising further. Traders can consider these levels as potential selling opportunities.
Breakouts: If the price breaks above the resistance zone (red shade) convincingly, it may indicate a bullish breakout, and the price could move higher to the next resistance level. On the other hand, if the price breaks below the support zone (green shade) convincingly, it may indicate a bearish breakout, and the price could move lower to the next support level.
Keltner Channel:
The Keltner Channel is a technical indicator that uses an exponential moving average (EMA) to create an upper and lower channel around the price action. Traders can use this channel to identify potential long and short positions.
Long Position: If the price is above the upper line of the Keltner Channel, it may indicate a potential long opportunity, as it suggests the price is trading above the average range and might continue in an upward trend.
Short Position: If the price is below the lower line of the Keltner Channel, it may indicate a potential short opportunity, as it suggests the price is trading below the average range and might continue in a downward trend.
Disclosure: I am not SEBI registered. I just wanted to let you know that the information provided here is for learning purposes only. Please consult your financial advisor before making any decisions. Tweets neither advice nor endorsement.

Bearish flag and poleExpecting more pain for HDFC BANK
It is currently painting a bearish flag and pole

HDFCBANK--Drop base Drop?? I am sharing the important levels of Support and Resistance. These levels plays a crucial role in trading decisions, as they act as reliable markers of price movements.
------>>Support levels are price points where an asset tends to find buying interest, preventing it from falling further.
---->Resistance levels, on the other hand, are points where selling pressure typically prevents the asset from rising higher.
Take a look at these levels and trade accordingly. Recognizing and respecting these support and resistance levels can help traders make informed decisions and manage risk effectively. They serve as key reference points for technical analysis and are vital tools in successful trading strategies.
Trade safe...Thank you guys for your support

Great buying opportunity in HDFC BANKPrice is undergoing expanded flat correction.
Good to accumulate around 1200-1300 levels for a target of around 2600 in medium to long term.
Price is heading towards pre covid levels while the revenue & net profit have almost doubled.
Do your own due diligence before taking any action.
Peace!!
