HALI34 trade ideas

HAL loosing interestHAL is loosing interest but could expect to bounce off the old support...
Only time will tell...


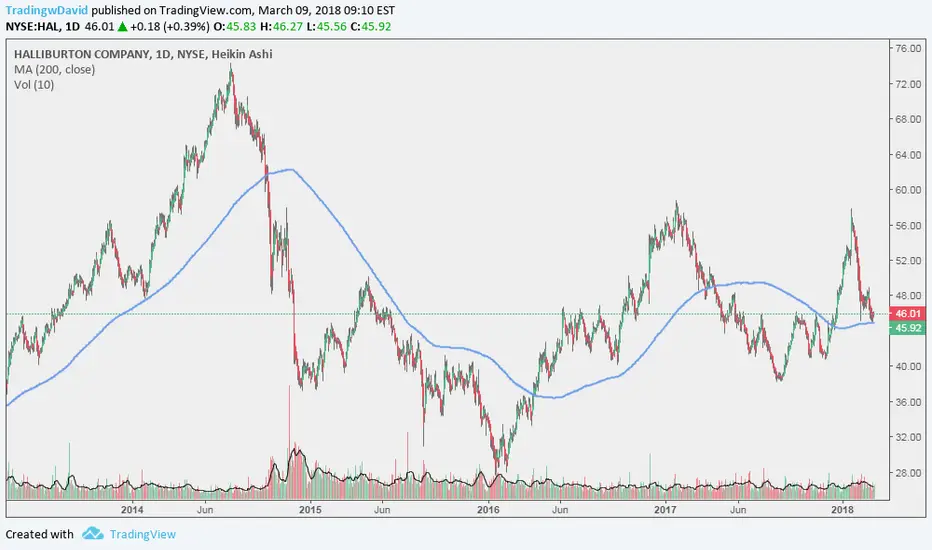
Hulliburton interesting situationHulliburton Company (HUL) has reached the 200-day Simple Moving Average, and this happens about one time a year. In last five years, the price has almost always broken the SMA (5 breakouts vs 2 bounces) resulting in big movement over the next few weeks. Will it be the same this time as well?
HAL Scenario for Earning Report DayHalliburton reported in its last quarter operations for $365 million, or $0.42 per diluted share. If we compare the income from continuing operations of second quarter 2017 around $28 million, or $0.03 per diluted share and compare with Crude Oil price, we can see how the pressure is correlating, but at the same time we have to keep in mind my forecast for WTI on November 7, so again we need to see a better present value for this share to take an action then.
However the market is expecting $0.46 for tomorrow earning report, comparing with last $0.42, my own EPS is >$0.39 and PEG >0.50% so still ok.
Have a Good Trading Week!
Cream Live Trading, Best Regards!


Strong ImpulseHi guys. I'm seeing some serious strength here in the pattern that HAL is showing. I humbly don't recommend shorting here but should a pullback occur it could be a good long trade. May the plants in your gardens grow tall and strong.


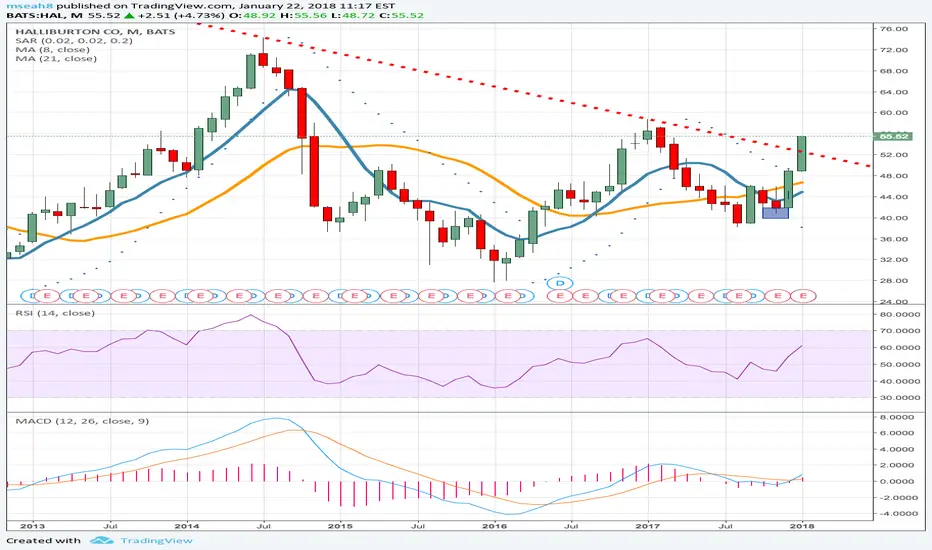
HAL Ready for MAJOR BULLISH MELTUP!50 DMA crossing above 200 DMA
Bullish Divergence
Strong Momentum to break the Neckline soon..

HAl - Oversold BuyHAL has been in a sideways consolidation for the past 2 months. Despite the rise in oil prices, HAL has maintained it's price range between $41 and $46.
Prices are currently at the bottom level, supported by the Darvas level. In addition, stochastic price levels are currently oversold.
Go long through Jan18 42 Calls when prices break $41.20. First profit target is $43.50.


HAL Halliburton Company short - in a downward trend 2017Review
Since the end of January of this year, a downward trend formed in the stock which, as things progressed, was confirmed over and over again. In addition, the much-observed SMA 200 was exited downwards. Currently, the value is far into the correction of the last downward movement, and it is worth keeping an eye out for short signals.
Outlook
The correction of the downward trend that is visible in the daily chart can be recognized as an upward trend in the subordinate trend size in the hourly chart. In order to find a short entry into this stock, one should first wait for a trend reversal in hourly chart. Here, an entry would be possible at a new low (P2) or subsequently from out of the correction after a new low, with a stop loss above the P3 that would have formed by then. The marker around 38.70 USD serves as a target area (green zone).
If the price clearly and sustainably rises above the area of 46 USD (red line), the short scenario should be abandoned.


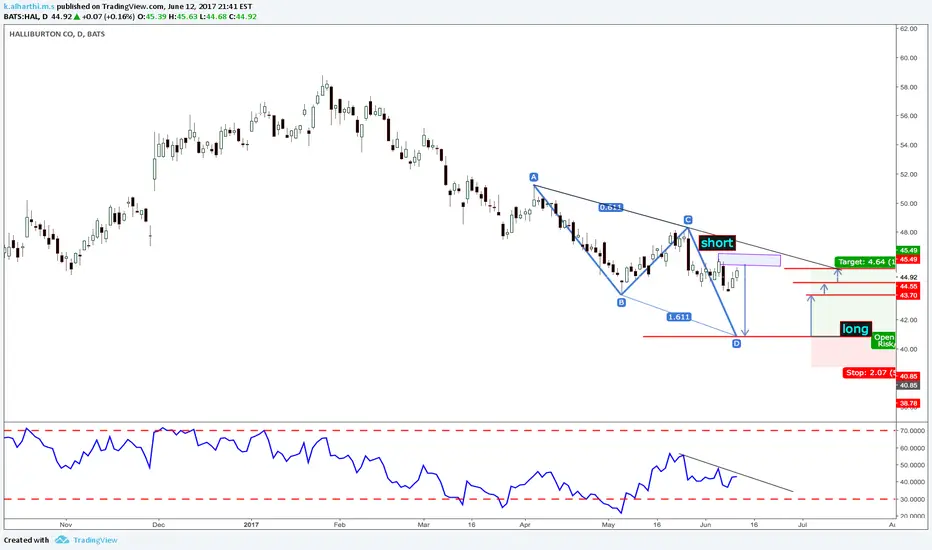
Halliburton CO buyUnder a technical perspective, the broken triangle and double bottom pattern indicates and upward movement, with a profit taking at a reasonable r:r pivot point.