Same game again ? 1-2-3?The TP of my former analysis was reached exactly:
HAL: TARGET 47$?
The midterm chart seems to be bullish for me. The uptrend is full intact, the stock closed near the last high, the last "2". Perhaps, a long position can be opended, if HAL2.49% can rise above the last high. TP could be 47$
Comment. After the exspected Breakout, we saw a retest of the breakout Level, and now there is the MOVE! It`s time to install or adjust your SL for that Long Position. For me, SL= 41$ is a thinkable SL-Level.
Now comes the same game again:
HAL: TARGET 50$?
If HAL can break through the last valid "2" i exspect a breakout with TP 50$
You just know Elliott wave-counting? Never heared of 1-2-3 counting? Then please have a look at
HALI34 trade ideas


HAL: Target 47$?The midterm chart seems to be bullish for me. The uptrend is full intact, the stock closed near the last high, the last "2". Perhaps, a long position can be opended, if HAL can rise above the last high. TP could be 47$
You just know Elliott wave-counting? Never heared of 1-2-3 counting? Then please have a look at


HAL V OilConfirming triangles of bottom as shown. This time, the 8-24 event altered the pattern, but temporarily. If a manipulated event occurs again, sending oil to the 20's, red arrow prevails. If not, as we inch down to the bottom of oil $, Hal strengthening RSI as noted.

#SPX#DJIA: Trade Ideas Off Of Recent Moves #CorrelationTradesMany stocks to take advantage of in this environment.
I'll be posting many trades throughout the day.
Tom

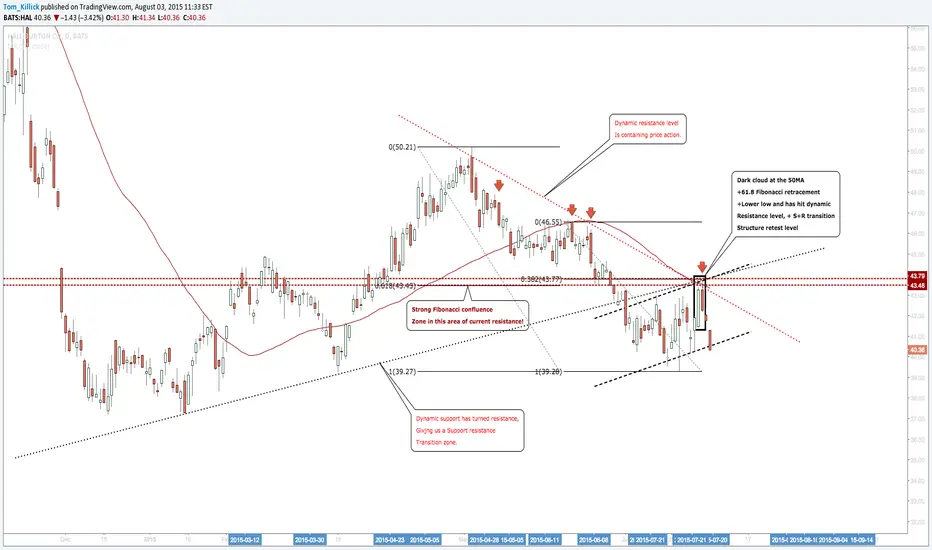
Halliburton: Looking Good For A Very Promising Short!Friends,
We are in key levels for a short from this level. With oil prices lowering among other factors, HA is fundamentally and technically armed for a promising short to the downside. Confluences tend to work on this stock, and have had good moves in confluence situations in the past.
Very promising indeed. There may be a flag set up occurring also, giving us an extension target, but I will leave this up to you traders to make your own target selection(s).
Best of luck,
Tom
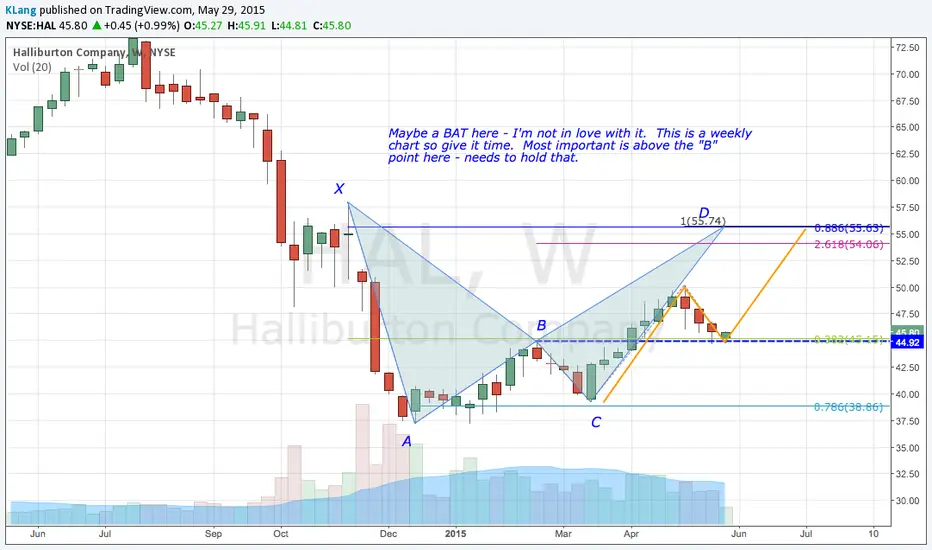
HALMight want a bit lower to put in a nice SHARK. Would be an interesting move as stops based on previous pivot are likely right above


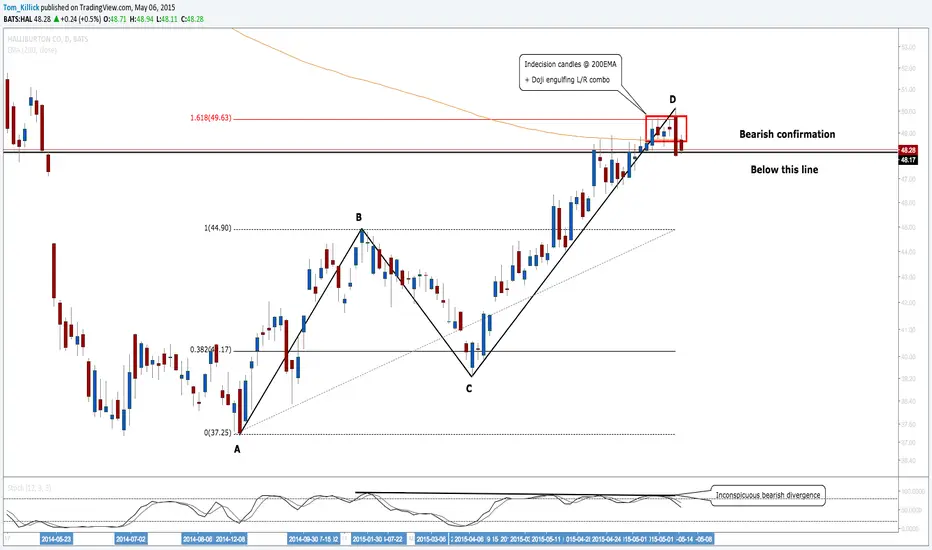
Halliburton: Nice ABCD Pattern Right At A Major Moving AverageFriends
Found a lovely ABCD pattern, right up at the 200EMA
1.We have an ABCD pattern
2. The pattern stalls, at the extension where expected. We also discover this is right where the 200EMA is currently at as well.
3. We have indecision candles at the ABCE D extension and at the 200EMA level.
4. We have a left/Right combo, showing the bulls are getting out the way at the moment.
5. We have a nearby localised support, where you can short to a very high probability if the level is broken
6. We have an inconspicuous, yet long term stochastic bearish divergence.
Thanks guys
Regards,
Tom
$HAL - Upside breakout potential PT @ $55 + Fundamentals/OilFibonacci Retracements point to a continued rally for HAL given the recent uptick in commodity prices.
I'm looking for a breakout to $52 (38.2 Fib Retracement), pullback to $48 (23.6 Fib Retracement), at which point i'm buying with a price target of $55 (50% Fib Retracement).
Could go higher, but the upside will be relatively capped given the level of the current US fracklog . Once prices justify completing and turning on these backlogged wells, it will cause the E&Ps to turn on the spigot, again pushing supply to a point where prices will have to react . (There is headline risk given potential Iran deal and capacity issues at cushing)
On a fundamental level, the recent divestiture of assets in concert with the baker hughes merger should be a long term positive for the company. I'd also look for them to further consolidate once the deal goes through as some smaller oil/gas service companies will start to feel the financial stress of the downturn during this time. Many of them operate in the more marginal areas of the shales/basins resulting in a higher breakeven cost given an expected return of about 10%. I'd also look for

Seasonal Trade With 84.8% Win Rate Over 28 Year Period.Seasonal Trade With 84.8% Win Rate Over 28 Year Period. Provided By Jake & Elliott Bernstein @ 2Chimps.net
Jake Bernstein will be a contributor on TradingView when Back Testing/Strategies are released. Jake is one of the Top Trading System Developers in the world with 45+ years experience and he is going to teach how to create Trading Systems and how to Optimize the correct way. Jake is also one of the first known traders to test the Statistical Validity of Seasonal Based Trades, Jake has one of the largest Databases know of Statistically Valid Seasonal Trades across Stock, Futures, and Forex Markets.
This is an Example of a Seasonal Trades Package that Jake will be releasing on TradingView.com


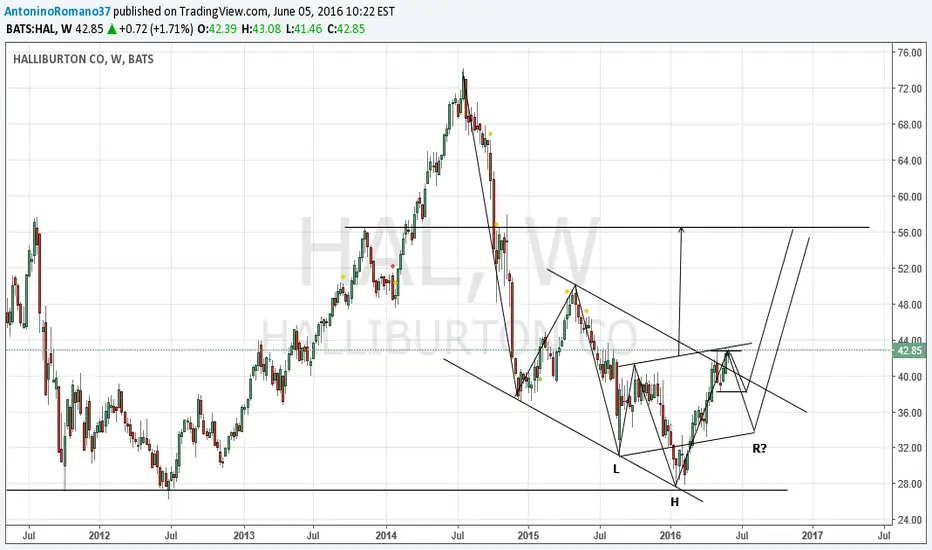
Long HAL This was indeed an extremely complex correction with two expanding diagonals forming the impulse waves and and a triangle as the B corrective wave. IF the upper trendline of the C wave is broken, we can see a resumption of prices to the upside till the entire month is completed. Trade well.
Cheers.

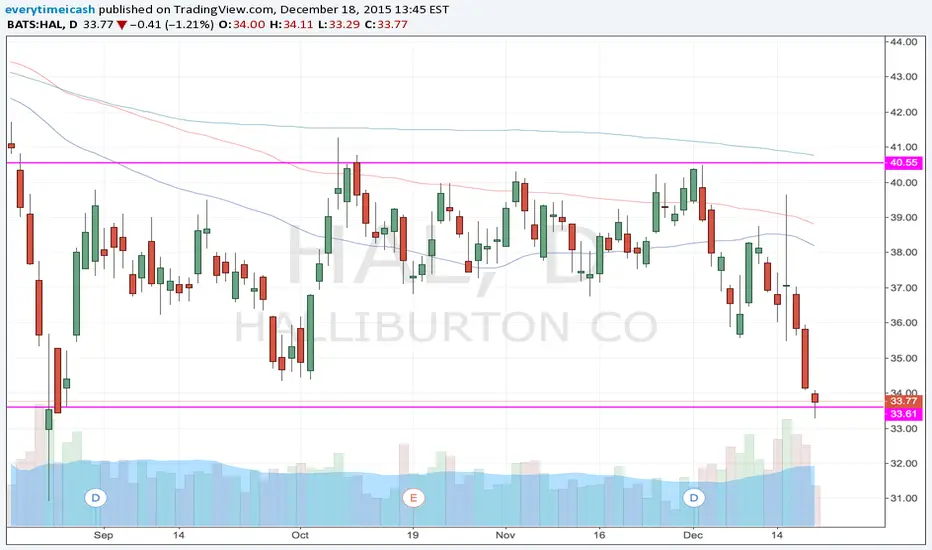
Stable Oil Prices Sets Up Well For Halliburton Near-TermThe stabilization in energy prices lately has meant relief in some oil & gas stocks. Halliburton shares have been one of them, putting in a series of higher lows since mid-January. The pullback in the previous two weeks sets up for a low risk buying opportunity (stop loss under $41.90). HAL is now poised to fill the gap from November ($46.70-$47.50 range) in the coming months with near-term resistance at $45.
Options Trade Idea : Sell the Mar 20 $41/$42 bull put spread for a $0.23 credit or better (still using the $41.90 level as a stop loss reference to minimize risks). Look to take profits at $0.05 credit and/or a move to $45 in the stock.


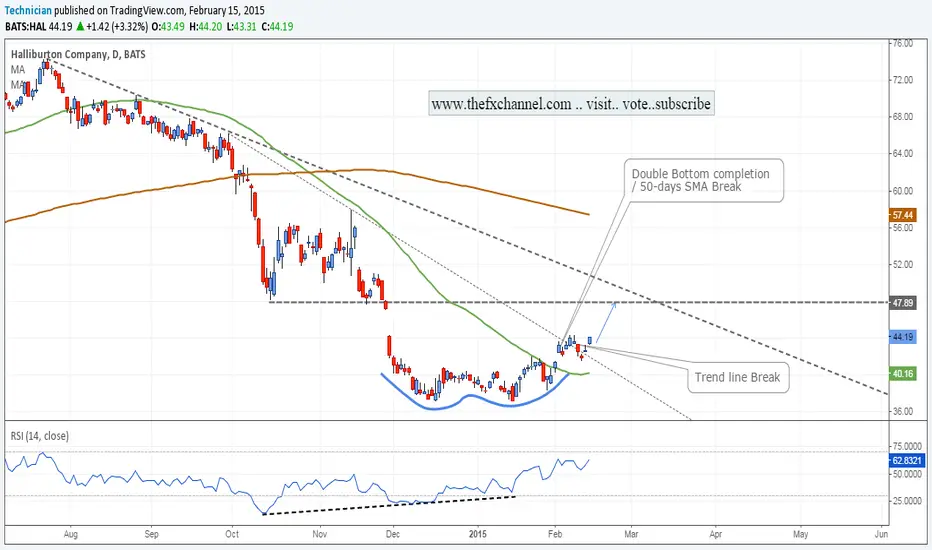
Halliburton Technical Analysis: Short-term Rebound!Halliburton Technical Analysis
- The price completed a double bottom formation
-50-days SMA breakout
-Trend line breakout
-Earlier bullish divergence on RSI momentum
Potential first upside target could be near 47.80-48.00 resistance area.. 41.00 level could be the invalidation level for this idea.
Be one of the first members of my new trading portal, check my new website thefxchannel.com , vote and subscribe. Thank you
Good luck, keep your stops tight..
twitter.com
www.facebook.com
plus.google.com
My best regards
Technician