I1DX34 trade ideas

IDXX Labs Settings Up For a Cup-Handle BreakoutNASDAQ:IDXX is forming a cup and handle breakout pattern. What's interesting is the cup's highs were long-term resistance at all-time-highs. So, a breakout leaves no resistance in the way of a rally.
I added a trend-based Fibonacci extension to try and get a price target, and it printed between $300-$307.
For trade updates, @DoozyTrader on Twitter.

IDEXX Laboratories Announces Increase in Share Repurchase PrograIDXX: IDEXX Laboratories, Inc.
2020-02-12 16:15:00
IDEXX Laboratories Announces Increase in Share Repurchase Program Authorization
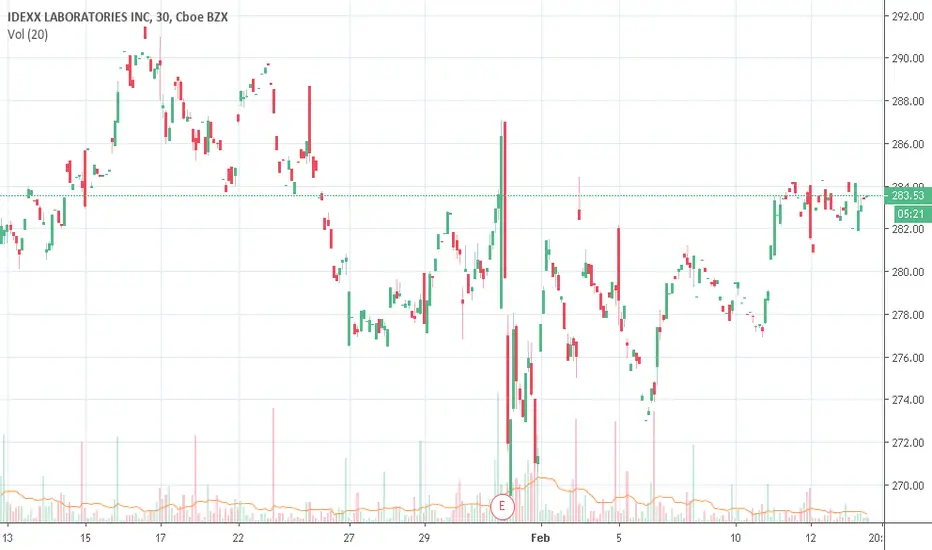

IDXX Breaks to the DownsideIDXX stepped down after reaching a new all time high. The stock is under moderately heavy Dark Pool Quiet Rotation™ at this time. The bottom red line indicates the top completion level support.

IDXX Slips Below Previous All-Time HighIDXX has dropped down below its previous all-time high after retesting the high resistance level. The stock has fairly consistent lows within the range. Support levels are potential bounce areas.

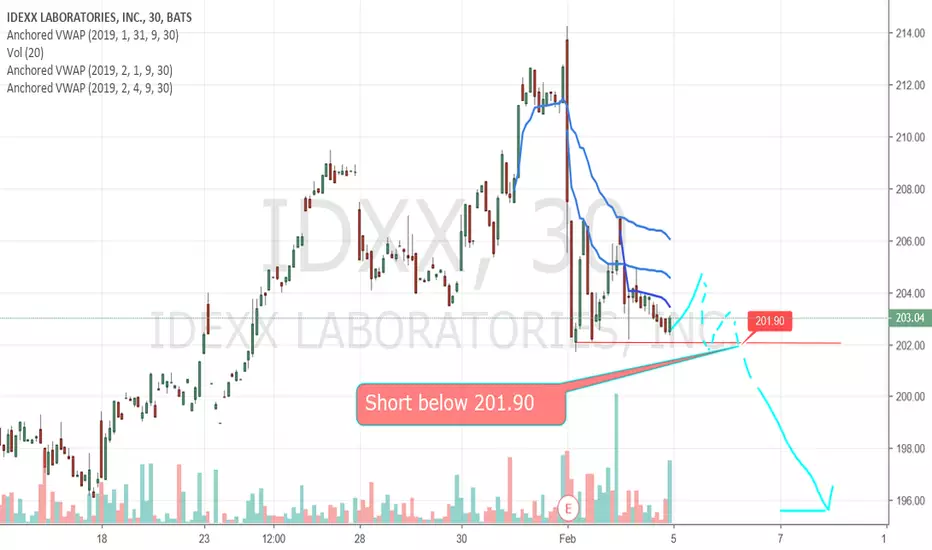
IDXX: Sort opportunityAn intraday high potential, Back Tested Sort Analysis.
We ll try to enter into the correction of the uptrend movement.
DETAILS ON THE CHART
NOTE: Entry range area above the entry point, is calculated upon 80% of the recorded pullback back tested past performances
DISCLAIMER: This is a technical analysis study, not an advice or recommendation to invest money on.

Short Setup!NASDAQ:IDXX short below 201.90
Please like, comment and follow if you like my ideas. THANK YOU!!!
Please note that this information is not a recommendation to buy or sell. It is to be used for educational purposes only.
IDXX LongLong based on trend analysis
My Entry: 203.75
Stop Loss: 190.00
Profit Target: 250.00
Risk/Reward: ~1:4

[IDXX] phase 4 -> don't buyThe price is going down. Below to 30MM and the RSI is going down too. Don't buy.

Buy Alert for IDXXMy WT Cross Strategy has alerted me to a buy signal for IDEXX LABORATORIES INC. ( IDXX ), at a price of $245.43 using a 120-min time frame. My idea is to buy the dip, at a price below $245.43. I will update when I get the signal to close the trade.
I am using the following parameters for this trade:
Channel Length - 1000
Average Length - 1
Average Length2 - 11
***
I have a Pro+ subscription for Tradingview so this gives me access to more data than someone with a free or even a lower tier sub. More data should enable me to construct a more robust model, so your mileage may vary if you are trying to use this strategy for a free account. Please use caution, and be advised. Good Luck All!


Long opportunityAs we can see, there's always a consolidation before an breakout. Since the trend keeps going, wait for the next candle to close above the resistance, thats my entry.
if there is a sign for trend reversal, it is a good short oportunity!

IDXX - Flag formation Long from $149.73 to $160 areaIDXX is forming a flag formation. It seems broken out of its flag consolidation & now heading upward. With the flag breakout it can go up to $160
* Trade Criteria *
Date first found- March 9, 2017
Pattern/Why- Flag formation
Entry Target Criteria- Break of $149.73
Exit Target Criteria- $160
Stop Loss Criteria- $146.23
Please check back for Trade updates. (Note: Trade update is little delayed here.)

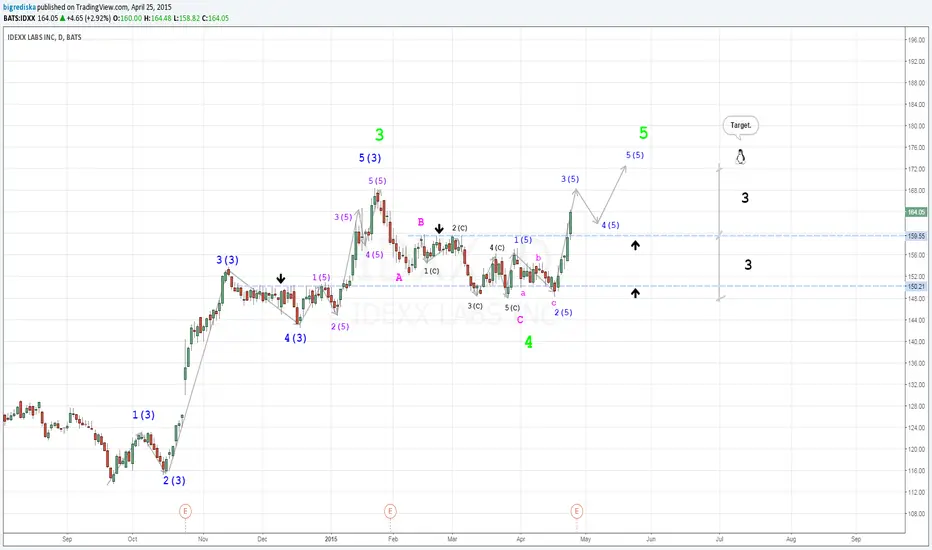
The obvious third wave. And, then, will be the fourth and fifth.The obvious third wave. And, then, will be the fourth and fifth.
IDXX inverted head and shouldersIDXX has just broken up out of a nine week pullback. Price struggled to break above the $150 half-figure zone during that time. Prior to this there was a very deep pullback (September/October 2014) which broke below the weekly 50ma for several weeks.
However, price is currently in an uptrend, despite the recent pullback - which, in fact, formed an inverted head and shoulders pattern suggesting a continuation to the upside. This was confirmed on yesterdays breakout bar - which also broke above the recent pivot high. Volume was up on the bullish bar, too, which all points to a continuation of the uptrend.
Overall, volume is on the low side (which could affect liquidity) but otherwise a good long opportunity.

