INFOSYS 📊 Chart Analysis – Infosys Ltd (INFY)
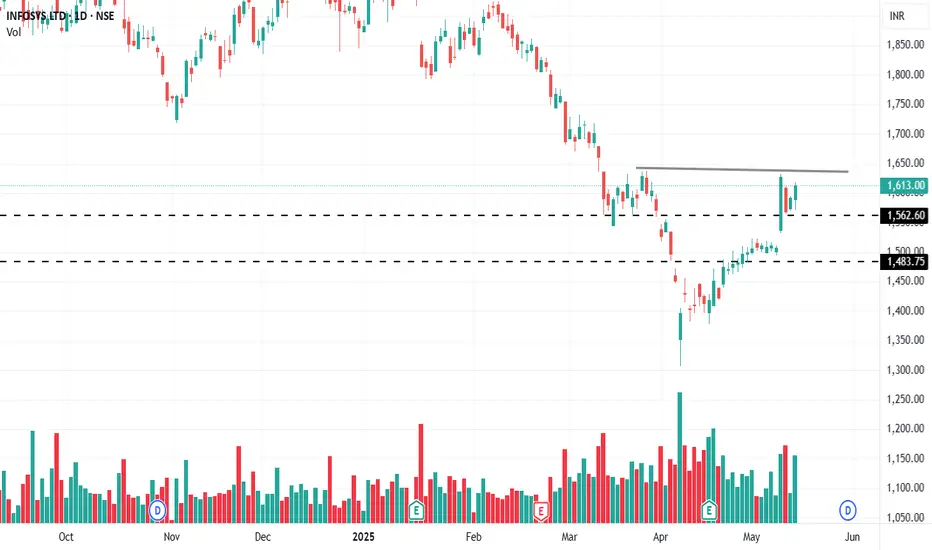
Currently, the stock is testing a key resistance zone between ₹1620–₹1630.
If the price breaks and closes above this resistance, it can signal a strong bullish breakout.
---
💼 Trade Setup (Based on Cup and Handle Pattern):
Entry (Buy): On a closing above ₹
Key facts today
Next report date
—
Report period
—
EPS estimate
—
Revenue estimate
—
4.313 BRL
17.86 B BRL
108.99 B BRL
3.53 B
About INFOSYS LTD
Sector
Industry
CEO
Salil S. Parekh
Website
Headquarters
Bangalore
Founded
1996
ISIN
BRI1FOBDR005
FIGI
BBG00XXWRH49
Infosys Ltd. is a digital services and consulting company, which engages in the provision of end-to-end business solutions. It operates through the following segments: Financial Services, Retail, Communication, Energy, Utilities, Resources, and Services, Manufacturing, Hi-Tech, Life Sciences, and All Other. The company was founded by Dinesh Krishnan Swamy, Senapathy Gopalakrishnan, Narayana Ramarao Nagavara Murthy, Raghavan N. S., Ashok Arora, Nandan M. Nilekani, and S. D. Shibulal on July 2, 1981 and is headquartered in Bangalore, India.

INFY_Neutral to Long- Price near one of the Resistances.
- Price has not broke out; However it showed good strength with big green candle
- Wait till how the next 2 days are going to be .

Infy Bullish Infy 1563 is showing signs of bullish for target 1620. Support 1549.
Currently Undervalued and has potential to target 1833.

INFY | Buy @LTP | SL below 1525 | Targets 1880, 2000Disclaimer:
This is not financial advice. Please do your own research or consult with a financial advisor before making any investment decisions. Investments in stocks can be risky and may result in loss of capital.

INFY 1H Chart Analysis (Bullish Bat + Falling Wedge)NSE:INFY
INFY 1H Chart Analysis (Bullish Bat + Falling Wedge)
In this 1-hour chart of Infosys Ltd (NSE: INFY), a Bullish Bat Harmonic Pattern has completed at point D, suggesting a potential reversal zone. Additionally, a falling wedge formation adds to the bullish confluence.
1. Pattern Struct

Infy India is in making of big move ... Disclaimer : This is just a chart analysis based on my understanding. Do your own research before investing.
Looking at daily chart of Infosys, first a chart pattern of M was made in the past which means stock moved up and come down. Now its trying to form a inverted head and shoulder chart patter

Infosys Ltd view for Intraday 21st May #INFY Infosys Ltd view for Intraday 21st May #INFY
Resistance 1570 Watching above 1573 for upside momentum.
Support area 1550 Below 1550 ignoring upside momentum for intraday
Watching below 1545 for downside movement...
Above 1570 ignoring downside move for intraday
Charts for Educational purposes onl

INFOSYS📈 Final Trade Plan – INFOSYS
Component Value
Trade Direction BUY
Entry Price 1578
Stop Loss (SL) 1465
Risk ₹113
Target Price 2177
Reward ₹599
Risk-Reward Ratio 5.3 ✅
Last Swing High 2004
Last Swing Low 1405
✅ Why This Trade is Strong
Strengths:
✔️ HTF, MTF, ITF all aligned UP—multi-timeframe confir

Infosys trend directionINFY 1613 is near the resistance 1643. Volume is negative. A close below 1568 would take to 1484 which would be a good entry for investment.
Infosys Long Idea on DailyInfosys has a huge volume upside breakout and looking bullish on the daily time frame
Entry Range - 1450 to 1550
Stop loss - 1350
Take Profit Range - 1900 to 2000

See all ideas
Summarizing what the indicators are suggesting.
Oscillators
Neutral
SellBuy
Strong sellStrong buy
Strong sellSellNeutralBuyStrong buy
Oscillators
Neutral
SellBuy
Strong sellStrong buy
Strong sellSellNeutralBuyStrong buy
Summary
Neutral
SellBuy
Strong sellStrong buy
Strong sellSellNeutralBuyStrong buy
Summary
Neutral
SellBuy
Strong sellStrong buy
Strong sellSellNeutralBuyStrong buy
Summary
Neutral
SellBuy
Strong sellStrong buy
Strong sellSellNeutralBuyStrong buy
Moving Averages
Neutral
SellBuy
Strong sellStrong buy
Strong sellSellNeutralBuyStrong buy
Moving Averages
Neutral
SellBuy
Strong sellStrong buy
Strong sellSellNeutralBuyStrong buy
Displays a symbol's price movements over previous years to identify recurring trends.
Curated watchlists where I1FO34 is featured.

Indian stocks: Racing ahead
46 No. of Symbols
See all sparks