ES1 (S&P500) Potential Long playPotential Long Play
Weekly Demand Zone Level over level with Daily Demand zone Located, low in location.
Fundamentals: Seasonality Shows up, Retailers are extremely short, Valuation is kind of high, but not extremely overvalued yet.
Keep this play in Mind.
ISP1! trade ideas

Stock Markets, Gold, Silver: Run With The Bulls!In this Weekly Market Forecast, we will analyze the S&P 500, NASDAQ, DOW JONES, Gold and Silver futures, for the week of May 25 - 31st.
The Stock Markets are bullish, so run with valid buy setups when they form.
Gold and Silver are relatively strong. With tensions in Gaza and Iran, this is expected. Valid buys should be taken.
Crude Oil is a tad bearish due to US inventories, so valid sells are warranted in the short term.
Enjoy!
May profits be upon you.
Leave any questions or comments in the comment section.
I appreciate any feedback from my viewers!
Like and/or subscribe if you want more accurate analysis.
Thank you so much!
Disclaimer:
I do not provide personal investment advice and I am not a qualified licensed investment advisor.
All information found here, including any ideas, opinions, views, predictions, forecasts, commentaries, suggestions, expressed or implied herein, are for informational, entertainment or educational purposes only and should not be construed as personal investment advice. While the information provided is believed to be accurate, it may include errors or inaccuracies.
I will not and cannot be held liable for any actions you take as a result of anything you read here.
Conduct your own due diligence, or consult a licensed financial advisor or broker before making any and all investment decisions. Any investments, trades, speculations, or decisions made on the basis of any information found on this channel, expressed or implied herein, are committed at your own risk, financial or otherwise.

Inside dayThe expectation for the short session on Monday is to trade inside the Fridays range on the daily chart in the S&P 500.

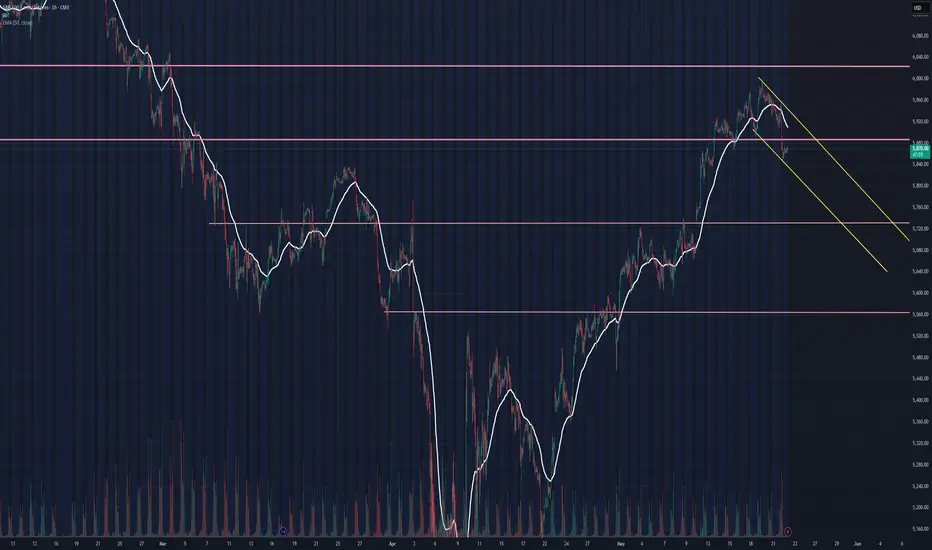
classic level to levelso we broke down from the big rising wedge into a flat bearflag
now we are making another bearflag and we break down from a neckline retest.
we are heading for a monthly value area low rotation
its an easy market theory analysis. nothing much but simple math

CME Gap Aligns with 4h 200 EMAThe CME Gap around 5710-5730 is beginning to align with the 4h 200 EMA.
4h RSI has been diverging bearish 3 times with each leg up within the channel above.
Also, a breakdown of that channel has measured moves down that align with both the 4h 50 and 200 EMA:
- 50 EMA an 0.5x measured move down
- 200 EMA a 2.5x measured move down
Pre-req on targeting the gap is a breakdown of the parallel channel shown above, and then loss of the 4h 50 EMA.
Good luck!

YBR ... Wealth Strategy 5-22-25low risk wealth strategy using bull put spreads approx 30 days to expiration ... trying to receive a annual rio of 15% or higher .... using alert on the mes incase of an armageddon move of market to the downside

New All Time High This Summer?Market is showing real strength here. After the uncertainty and those tariff windfalls, price is recovering well and looks like it’s setting up for continuation.
As long as we stay above that Monthly FVG, I think the path to a new all time high this summer is pretty realistic. That could possibly be supported by Nvidia earnings in late May and interest rate cut in June.
What are your thoughts?

A 50-50 environmentThe stock market is focused on the outcome of the tax bill and it has created a 50-50 environment. The bias for the stock market is for move higher.

What do you see now?Updating the original, what do you see now?
Was demand where, you thought it was, did market structure show you any hints?
#tradewhatyousee

updating So as mentioned, the lower demand zone to the higher level supply at the redline, #tradewhatyousee

Adding Demand Zone below, Since we broke the zone, highlighting the next demand zone, have in mind no advice being given here, but if you look at supply/demand, you should be aware of the other moves within the market, also the red line
#tradewhatyousee

ESM2025, go lower to go higher?What do you track? fundamentals? technicals?
Investor sentiment, is confusing at times,
#tradewhatyousee

Overnight consolidation? into demand area?Maybe, maybe we are in a demand area, and consolidating, the reaction or change of character needs to show strength in order to go higher, otherwise, run the stops below in order to go higher, lots of action to take

SPY to pullback AFTER bullish Thursday Friday Gap Fill TargetI was initially skeptical of the bearish case because we were able to stand strong against the Moody's downgrade, but I guess all good things come to an end, at least temporarily, especially with the bond yields spiking higher today.
I drew a channel off the downtrend and I think it is pretty wide, so I would expect us to follow it at least for the next week, obviously if we break to the upside then you can probably put the bearish concerns to rest, but until then with the lower low I think we are decidedly bearish for now, especially if we make a lower high to end the week (pretty likely)
I wouldn't pile into puts just yet, as that is what the greedy retail trader is doing, and we all know how that works, also seasonally the Thursday Friday leading into memorial day are usually bullish, combined with Bitcoin making new highs, I think we will actually have relatively neutral to bullish price action to close the week.
The Tuesday-Thursday after memorial day are seasonally a bit more bearish, so I think that is where we will see a surprise sell-off and possible fill of that huge bar around the 5720 area.
There is a lot of price action between 5600 and 5700 so I think the support there will be strong, this is only a pullback and I am still bullish long term.
Good Luck and Happy Trading.
ES Possible Long setupES is returning back to a Strong Demand zone on the 15 minute timeframe, I've refined the entry to a 5 min timeframe demand zone within the 15 minute zone, automatic target 2r, can target higher if wanted

S&P ES Long setup target 5963.50 / Calls SPY target 596Fibonacci technical analysis : S&P 500 E-mini Futures CME_MINI:ES1! has already found support at the Fib level 78.6% (5623.50) of my Down Fib. Last Daily candle (May 2) has closed above retracement Fib level 78.6%. My Down Fib guides me to look for CME_MINI:ES1! to eventually go up to hit first target at Fib level 127.2% (5963.50).
CME_MINI:ES1! – Target 1 at 127.2% (5963.50), Target 2 at 161.8% (6205.50) and Target 3 at 178.6 (6322.75)
Stop loss slightly below the 61.8% retracement Fib level (5506.25).
Option Traders : My AMEX:SPY chart Down Fib shows price to go up to Target 1 at 127.2% (595.82), Target 2 at 161.8% (620.50) and Target 3 at 178.6 (632.50)
Stop loss slightly below the 61.8% retracement Fib level (549).
Enjoy the trading process and take time to smell the roses🌹

Rest dayWith the dramatic move in the S&P daily chart based on concerns, I do not look for another dramatic move lower but rather Thursday trading inside of Wednesday's range. What could change this is fundamental information that increases the markets nervousness and continues the break to lower prices.

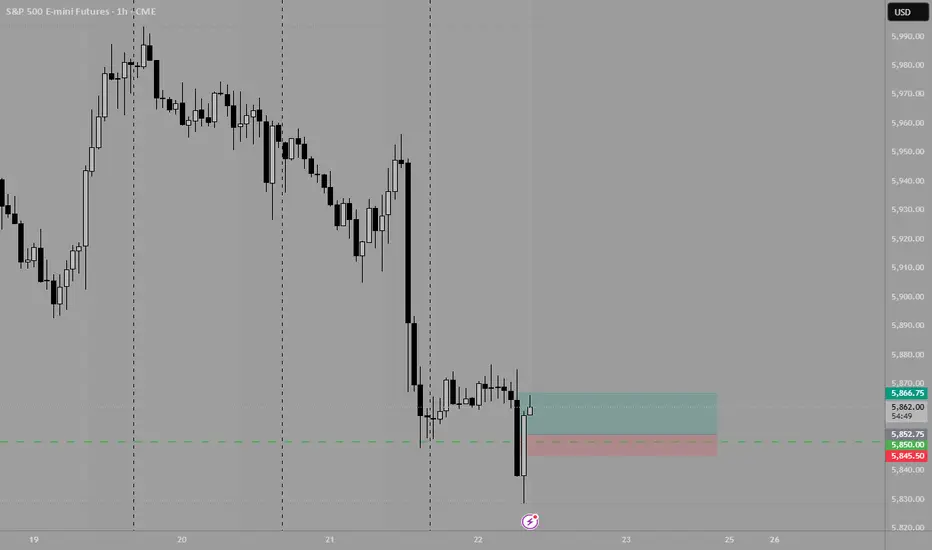
MES Short🔴 High Risk Short
Bearish Market Structure Shift caused by price meeting origin of Daily MSS from Mar04. Trade mapped on the hourly timeframe; focusing on impulsive swing high at $5956.25 that created MSS.
Entry on measured 61.8% fib retracement @ $5914.75.
TP1: $5873.25 (1R)
TP2: $5822.25 (2.25R)
Second take profit level lines up with both 200SMA + bullish 4H channel support , adding confluence to trade idea. It stands to reason price will retest the support of a longstanding bullish channel.
Notes:
•Stops moved to BE once TP1 hit
•Trade is high-risk due to SL having no significant higher timeframe importance.
The reason I’m focusing on this leg of price action rather than the 4H high at $5993.25, is because this hourly high specifically created the higher timeframe MSS. It suggests there’s an unusually high amount of sellers at that level.

Equity Prices FallingEquity indices selling pressure is continuing from yesterday, with Russell leading the way to the downside being down over 2.5% on the session while the S&P and Nasdaq both were about 1.5% lower. Looking at relative strength on a daily basis for the S&P, the market was trading at the highest level since July of 2024 after having 6 consecutive days of trading higher. Gold and Silver also traded higher on the session over 1% and have marked a higher high each of the last 3 trading sessions.
Crypto futures also traded higher on the session with Bitcoin and Solana leading the way, with Bitcoin hitting a new all time high price of $110,175. Relative strength is also relevant for Bitcoin on a daily basis as the level has not been this high since December of 2024. Tomorrow, more economic data will be released looking at PMI and Initial Jobless Claims. Initial jobless claims for 2025 have been directly in line or better than expected 14 out of the last 20 reports, and this report has 3rd highest forecasted number of the 2025.
If you have futures in your trading portfolio, you can check out on CME Group data plans available that suit your trading needs tradingview.com/cme/
*CME Group futures are not suitable for all investors and involve the risk of loss. Copyright © 2023 CME Group Inc.
**All examples in this report are hypothetical interpretations of situations and are used for explanation purposes only. The views in this report reflect solely those of the author and not necessarily those of CME Group or its affiliated institutions. This report and the information herein should not be considered investment advice or the results of actual market experience.

Bullish Weekly Bias IndexesBullish Indexes Target on Weekly perspective.
Expecting Nasdaq to breach trough the W IFVG and reach 22,5588.00 within the next few weeks.
Expecting S&P500 to use the W IFVG as "Support" and reach 6,235.00

Looking to buy ESES is sustaining bullish structure on 1H and 4H. Currently in discount zone. ES swept liquidity below daily lows, filled 4H FVG and starting to reverse. 1:3 RR long trade potential.

Sideways market environmentThe lack of follow-through to the upside on Tuesday in the S&P 500 daily chart implies a market waiting for new information and a sideways market environment which is the expectation for Wednesday's movement.
