Intraday Playbook ES Futures: Trade Setup & Context CME_MINI:ES1!
Big Picture Context
Please see related trade idea.
In this analysis, we refine our intraday levels to identify potential trade setups. We also review recent price action and present a high-probability long trade example that frequently offers favorable risk-reward dynamics when it plays out successfully.
See chart image below reviewing yesterday’s long trade opportunity.
Example Trade Setup: SFP Long
Time frame: 1 hour or 30 mins
• Entry: 5612
• Stop: 5595.50 (below SFP candle)
• Target: 5682 (mCVAH — confluence with recent highs)
• Risk: 66 ticks
• Reward: 280 ticks
• Risk/Reward Ratio: 4.2 R
Note: Past performance is not indicative of future results.
________________________________________
Intraday Market Structure Review
What has the market done?
• ES Futures have rallied and reclaimed a key technical level.
• Currently trading above:
o March 2025 low
o 2025 mid-year level
o Developing Value Area Low (VAL) for the 2025 Volume Profile
What is the market trying to do?
• Recover prior months' losses.
• Price action is climbing steadily, establishing higher lows.
How well is it doing?
• Despite headline risks, ES futures show resilience.
• Price has painted green candles in the full session for the past 10 consecutive days—a strong bullish structure.
________________________________________
What Is More Likely to Happen from Here?
Scenario 1: Pullback and Continuation Higher
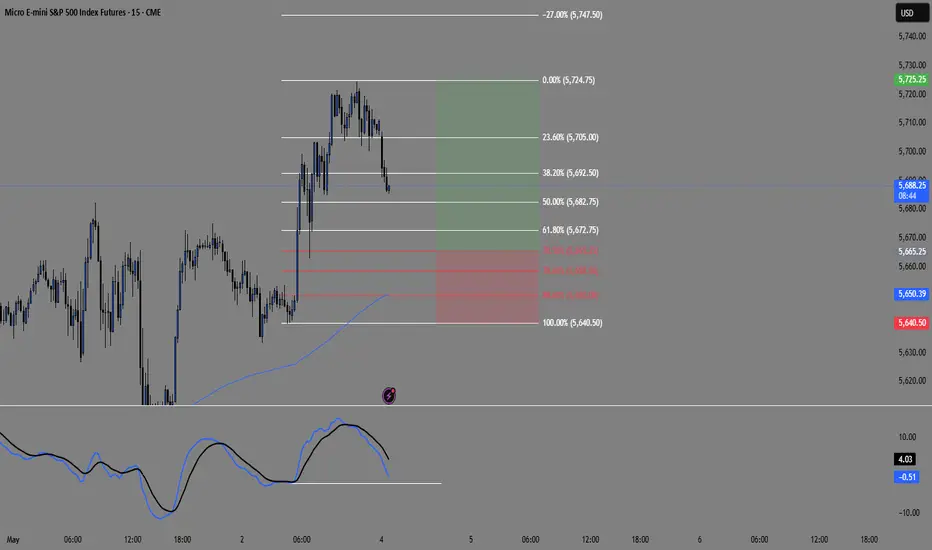
A pullback toward the 0.618 Fib retracement and mCVAH confluence could offer another long setup, targeting the April 2nd high. This is further supported by NQ already reclaiming those highs, with ES still lagging but showing strength.
Example Trade Idea:
Time frame: 1 hour or 30 mins
• Entry: 5688
• Stop: 5680
• Target: 5724 (May 2 High)
• Risk: 32 ticks
• Reward: 144 ticks
• Risk/Reward Ratio: 4.5 R
Target may be adjusted if relative volume and delta support strong momentum toward April 2nd highs.
________________________________________
Scenario 2: Further Consolidation
• Sellers push prices back into last week's balance/value area.
• Market consolidates and builds energy for a likely next leg higher.
• No short setup is presented, as current risk and stop placement do not justify initiating short positions.
Important Notes:
• These are example trade ideas not intended to be a recommendation to trade, and traders are encouraged to do their own analysis and preparation before entering any positions.
• Stop losses are not guaranteed to trigger at specified levels, and actual losses may exceed predetermined stop levels.
ISP1! trade ideas

OTEUM EXPERT CALL: SP500 – Pre‑FED Crumb‑ChaseOTEUM EXPERT CALL: SP500 – Pre‑FED Crumb‑Chase 🍞🚀
Market’s in grind‑up mode ahead of the FED 💹, squeezing what’s left toward those major swing targets & looming resistance walls 🧱. Only a few tasty crumbs remain on the upside—grab ‘em quick, trail tight, and don’t overstay the party 🎉⚠️.

Follow through to the upside is expectedFollow through to the upside is expected on the daily chart in the S&P 500 with an upside objective of 5750.

CME Gap Fill IdeaShort until the gap, then long.
Daily S&P E-mini futures chart, a failure to remain above the 200 EMA and failure to reach the 200 MA, now pushing on the 50 EMA and MA and a confirmed death cross.
We have a CME gap between 5332-5355 (so approx 5345ish as a target).
Scenario here is a move down to the gap to act as a springboard to get back above the 50/200 EMAs and MAs and have it cross back over.
Resistance area aligns with 200 MA.
Pattern formed looks like an inverted HS or possibly a quasimodo.

How to Set Up and Use OCO Orders on TradingViewThis tutorial video explains what OCO (Order cancels orders) are, how they work, how to place them in Tradingview, and how they relate to bracket orders.
You'll learn how to add them to new entry orders as well as existing positions.
There is a substantial risk of loss in futures trading. Past performance is not indicative of future results. Please trade only with risk capital. We are not responsible for any third-party links, comments, or content shared on TradingView. Any opinions, links, or messages posted by users on TradingView do not represent our views or recommendations. Please exercise your own judgment and due diligence when engaging with any external content or user commentary.

ES_F | Daily Chart | 07 MAY 2025Scales
- S: 4916 to 5481 completed G>Y
- M: pending at 6131 min., 6884 max
- L: pending at 4789
Forecast & Targets
- ST: limited upside to 5764.29 min, 5971.85 max
- MT: bearish to 4789.57
- LT: rally to 6884.94 max (SEP 2026)
#ES #SPX #SP500 #ES_F

Waiting for the FedThe S&P 500 structure on the daily chart is set up for the Fed comments on Wednesday. A break lower with a shadow at the lows would be typical behavior.

ES (2025/05/06)In line with my previous analysis.
But at this moment, I am seeing trivial fluctuations so I do think there will be more up space in the near term. Target price is still quite far, and I am seeing strong volume when there are "Buying the dip" opportunity vs. very weak trivial volume when it comes to dumping.
Patiently waiting for TP to reach, so that I could close out some of the longs to realize.
MES1!/ES1! Day Trade Plan for 05/06/2025MES1!/ES1! Day Trade Plan for 05/06/2025
📈 5625 5638 5650
📉 5614 5602 5590
Thanks to all my followers! Truly appreciate the support!
Please like and share for more ES/NQ levels Tues & Thurs 🤓📈📉🎯💰
*These levels are derived from comprehensive backtesting and research and a quantitative system demonstrating high accuracy. This statistical foundation suggests that price movements are likely to exceed initial estimates.*

ES weekly trading plan for May 6 - May 9ES closed bullish last week. I expect the high of previous weekly candle to be taken out. 15M structure is bullish and in discount zone. I expect manipulation in London open on Tuesday, reversal and move to previous week high

#ES1! "E-Mini S&P500" Index Market Bullish Robbery Plan🌟Hi! Hola! Ola! Bonjour! Hallo! Marhaba!🌟
Dear Money Makers & Robbers, 🤑 💰💸✈️
Based on 🔥Thief Trading style technical and fundamental analysis🔥, here is our master plan to heist the #ES1! "E-Mini S&P500" Index Market Heist. Please adhere to the strategy I've outlined in the chart, which emphasizes long entry. Our aim is to escape near the high-risk YELLOW MA Zone. It's a Risky level, overbought market, consolidation, trend reversal, trap at the level where traders and bearish robbers are stronger. 🏆💸"Take profit and treat yourself, traders. You deserve it!💪🏆🎉
Entry 📈 : "The vault is wide open! Swipe the Bullish loot at any price - the heist is on!
however I advise to Place buy limit orders within a 15 or 30 minute timeframe most recent or swing, low or high level. I Highly recommended you to put alert in your chart.
Stop Loss 🛑:
Thief SL placed at the Nearest / Swing low level Using the 3H timeframe (5440) Day/Swing trade basis.
SL is based on your risk of the trade, lot size and how many multiple orders you have to take.
🏴☠️Target 🎯: 5730
💰💵💸#ES1! "E-Mini S&P500" Index Money Heist Plan is currently experiencing a bullishness,., driven by several key factors. .☝☝☝
📰🗞️Get & Read the Fundamental, Macro Economics, COT Report, Geopolitical and News Analysis, Sentimental Outlook, Intermarket Analysis, Index-Specific Analysis, Future trend targets with Overall outlook score... go ahead to check 👉👉👉🔗🔗🌎🌏🗺
⚠️Trading Alert : News Releases and Position Management 📰🗞️🚫🚏
As a reminder, news releases can have a significant impact on market prices and volatility. To minimize potential losses and protect your running positions,
we recommend the following:
Avoid taking new trades during news releases
Use trailing stop-loss orders to protect your running positions and lock in profits
💖Supporting our robbery plan 💥Hit the Boost Button💥 will enable us to effortlessly make and steal money 💰💵. Boost the strength of our robbery team. Every day in this market make money with ease by using the Thief Trading Style.🏆💪🤝❤️🎉🚀
I'll see you soon with another heist plan, so stay tuned 🤑🐱👤🤗🤩


MES Long SetupSimilar to NQ we are developing a 15 min hidden divergence with price action. Also OTE aligns well with demand zones and higher time frame areas of interest. if we confirm divergence and reach ote level ill buy
The Candles Are Bullish… BUT Is a Reversal on the Horizon?Back on April 28th, we talked about the ES potentially pushing higher — and guess what? It did exactly that! 🎯
Now we find ourselves at a key crossroads.
A new month is here, and with the previous monthly candle officially closed, there’s a strong case to be made for even higher prices — possibly up to the 5776 level. 📈 That said, I’ll be diving into the analysis today where I’ll also touch on some reasons why short-term selling could still show up.
To be fair, the price action from April (1st–30th) hasn’t given us a lot of evidence for a major reversal, but as always, it’s our job as analysts to stay sharp and open to all possibilities — especially in today’s climate.
Right now, I’m still on board the bullish train 🚂 and the charts continue to suggest upward momentum. But I’ll be watching closely for any shifts that might hint at a change.
What about you? What’s your take on the current setup? Let’s get the conversation going — I’d love to hear your thoughts!
Let's Keep Studying - One Candlestick At A Time!

Short Buddy!!!All 4 of my confluences have been met.
1hr divergence
1hr pull back
1hr nsync
And price action.
What are your thoughts?
Short bias for the next two days in my opinion.
Trade safely my friends

The bias is for move to the upsideThe bias for the S&P 500 daily chart is for move to the upside but if we do get that follow-through I'm not looking for a dramatic move as the market gets ready to hear what the Fed has to say on Wednesday.

May 2nd Trade Journal & Stock Market AnalysisEOD accountability report: +598.75
Sleep: 6 hour, Overall health: :thumbsup:
Another great day in the market, Signals worked decent.
Daily Trade recap based on VX Algo System
— 9:40 AM Market Structure flipped bearish on VX Algo X3!
— 11:10 AM VXAlgo ES X1 Sell Signal, (double sell)
— 2:53 PM VXAlgo ES X1 Sell Signal( double sell + x3 sells)
— 3:30 PM Market Structure flipped bearish on VX Algo X3!
Next day plan--> Over 5650 = Bullish, Under 5650 = Bearish
Video Recaps -->https://www.tradingview.com/u/WallSt007/#published-charts

S&P Futures will Revisit 5611.50 in the next week or Two.S&P Futures will Revisit 5611.50 in the next week or Two. Buy more shorts if it goes higher.

ID: 2025 - 0095.5.2025
Trade #9 of 2025 executed.
Trade entry at 137 DTE (days to expiration).
Trade construct is a PDS (put debit spread) at Delta 15 combined with a PCS (put credit spread) at Delta 15. Overlapping short strikes give it the "unbalanced" butterfly nomenclature.
Sizing and strike selection is designed to keep the risk/reward "AT EXPIRATION" to a 1:1 risk profile. This lets charm work it's magic (second order greek), while exploiting the fact that this is a non-directional bias. The process is a disciplined and systematic approach letting time decay evaporate the extrinsic time value from the short options until target profit is achieved.
OF NOTE: This trade opened at EXCELLENT fills, and there is zero risk to the upside. The danger is of a catastrophic move to the downside, which will bring in phenomenal gains for ID 006 and 008. 😊
Happy Trading!
-kevin

ES Futures at a Crossroads: Fed Steady, Market ReadyCME_MINI:ES1!
Recent Market Performance
ES Futures experienced a significant decline of 22.30% from the February 19, 2025 high of 6218.50 to the recent low of 4832 on Monday, April 7th, 2025. This drawdown included a sharp 16.30% sell-off, triggered by the announcement of reciprocal tariffs, marking a decline from the April 2, 2025 high to the April 7th low.
Since forming that low, ES Futures have rebounded impressively—rallying 18.48% into the May 2nd high, retracing well over 50% of the losses. Notably, price action has closely respected Fibonacci retracement levels, as illustrated in the accompanying chart.
Macro Fundamentals
There are several macroeconomic considerations at play:
• Quarterly GDP data appears skewed due to front-loaded imports, evident in the January and February import numbers.
• This week’s March trade balance, imports, and exports data for both the U.S. and China will be crucial. These figures will shed light on how escalating tariff tensions have influenced Q1 business activity.
• The key event this week is the Federal Reserve interest rate decision and FOMC press conference. Of particular interest will be how the Fed’s risk outlook has evolved in light of Trade War 2.0, along with updates to growth and inflation forecasts.
While the Fed is expected to hold rates steady, there are increasing calls from President Trump to cut rates. Although recent soft data has shown signs of deterioration, this has not yet translated into hard data. In fact, April’s Non-Farm Payroll (NFP) report beat expectations, underscoring continued economic resilience.
Key Question: What Comes Next?
Will ES Futures continue to trend higher, reverse lower, or consolidate?
Key Technical Levels
• mCVAL: 5635
• Upper Neutral Zone : 5620 – 5585
• March 2025 Low: 5533.75
• Lower Neutral Zone : 5171.75 – 5150.75
Fibonacci Retracement Levels (2025 High to Low)
• 2025 High: 6218.50
• 0.786 Retracement: 5921.75
• 0.618 Retracement: 5688.75
• 0.5 Level (Mid-Range): 5525.25
• 2025 Low: 4832
Our View
We believe downside risks are currently minimized, barring a new market-moving development—such as a disruptive social media post. Q1 earnings have broadly reflected strength, reducing the probability of further downside in the near term.
Given the current backdrop:
• Positive news could act as a catalyst for higher prices.
• In the absence of significant newsflow, we expect consolidation, followed by a potential resumption of the upward trend.
Scenario 1
A pullback to either the blue support zone near the 0.618 Fibonacci retracement confluence, or a deeper pullback towards the confluence of the 2025 mid-range and March 2025 lows, followed by a continuation higher.
Scenario 2
Seasonality supports consolidation. Historical index behavior at this time of year further aligns with the potential for sideways movement before the next leg higher.

OTEUM EXPERT CALL: SP500 – Catch-the-Bounce EditionOTEUM EXPERT CALL: SP500 – Catch-the-Bounce Edition 🪙🚀
We’re fishing LONG for a quick, tactical bounce LONG as price aims to poke into a major resistance zones ⚙️📈 Once the dust settles and the bounce plays out, we still expect the macro down-draft to take over, so keep your suitcase packed for a swift exit 🎢✂️.
Main risk? A stray White House tweet or (not so much) surprise policy grenade? 💬💥—impossible to time, so size down and run a tight leash on risk 🦺⚖️.
#SP500 #Dailymap #BouncePlay #RiskOn #OTEUM

Dow Jones - April ReviewUnlike ES and NQ, YM has the potential to book massive gains if the algorithm was to spool prices higher into the $42,836 lower range FVG in comparison to the others. However, if the market is weaker than many anticipate, YM could be frontrunning the overall stock index pairs (out of NQ, ES and YM) to the downside.
Gun to my head, we are bound for some short term bullish price action back up into the premium array
